Nursing Safety Outcomes: Peer Data Collection Guide

CNO on phone call extracting peer safety data with notepad showing crossed-out impressions and one circled metric

Key Takeaways

  • Most behavioral health CNOs rely on hallway impressions when asked about peer nursing safety outcomes. A step-by-step collection process turns those impressions into evidence that holds up in budget meetings and on the unit floor.
  • Matching peer facilities on patient severity level, unit type, and staffing model determines whether their outcomes apply to yours. Matching on at least three criteria makes two peer calls more useful than five random ones.
  • The same peer data serves two audiences when you package it right: a metrics summary your CEO can act on and a nurse-centered narrative your charge nurses will trust.

To build a safety case your CEO will fund and your nurses will believe, you need peer nursing safety outcomes from similar behavioral health facilities. A step-by-step collection process, built from peer nursing leaders with verified metrics, is what holds up in a budget meeting and on the unit floor. Facilities using documented safety technology have cut violent incidents within three months [1]. That’s the kind of peer evidence this guide helps you capture and package.

What Peer Nursing Data Actually Delivers

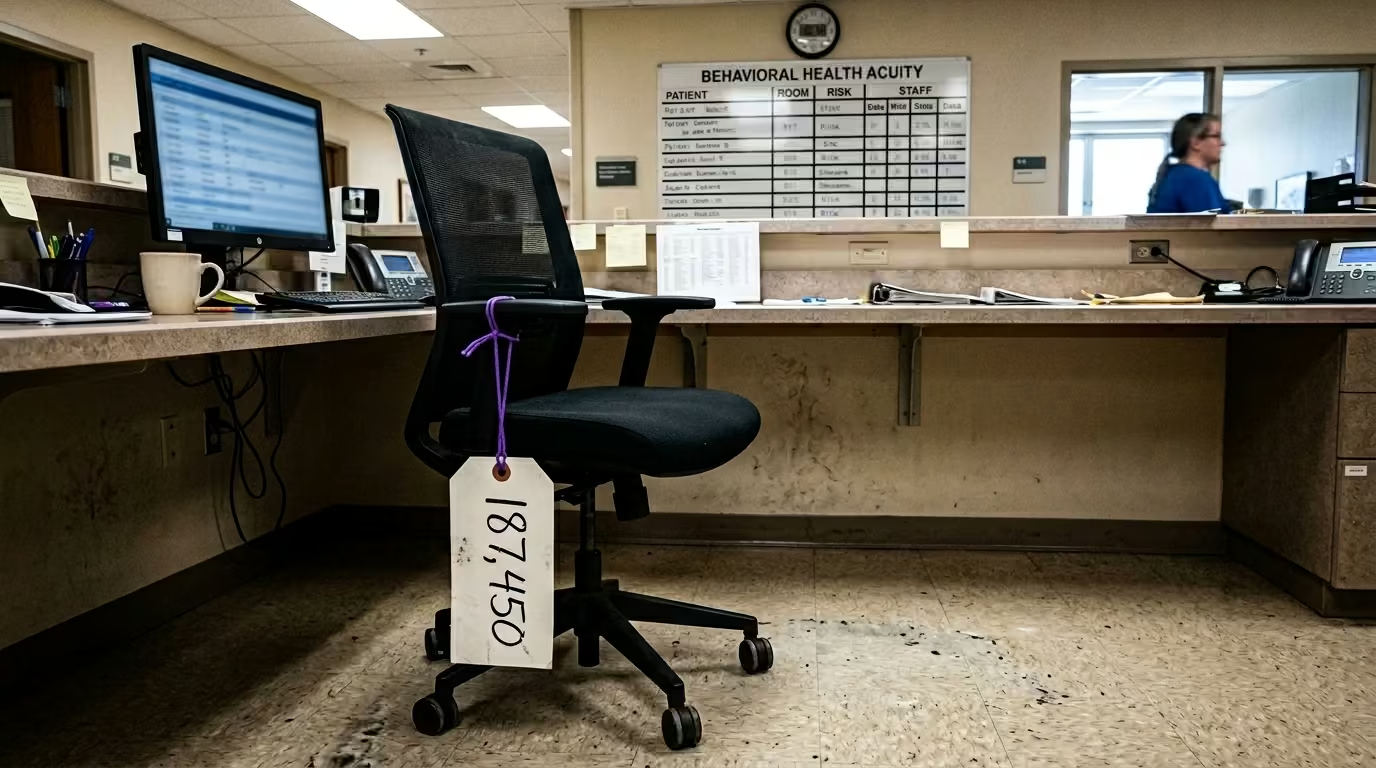
Your Director of Nursing mentions a peer facility “saw great results.” She can’t name the facility, the metric, or the timeline. That impression won’t survive your next executive meeting.

The gap is collection. Among mental health nurses, 83% reported violence in the past year [2]. The problem is real and shared. Facilities using safety programs are documenting results. ROAR’s deployment across 350+ behavioral health facilities means a large pool of similar organizations are tracking nursing safety outcomes right now.

Joint Commission standards require violence prevention programs that include trend analysis and governance reporting [3]. Peer outcome comparison supports that requirement. Think of it like keeping a maintenance log for a building: you do it because the inspector expects it, and because it tells you where the cracks are forming.

This process produces a peer evidence file that serves two audiences:

  • Executives who need metrics tied to timelines
  • Nurses who need proof someone listened

The sections below walk through how to build it.

Identifying the Right Peer Facilities

A vendor offers you three references. One is a 200-bed acute care hospital with a small psych unit. Another is a 40-bed residential center. Your facility is a 60-bed acute stabilization unit. None match without criteria.

Psychiatric and substance abuse hospitals report 110.4 violent incidents per 10,000 workers [4]. That rate varies sharply by facility type. Acute stabilization units with short stays will always show higher rates than residential programs with 30-day averages.

Match peer facilities on at least three of these five variables:

VariableWhy It Affects Comparability
Patient severity level (acuity)Acute stabilization, residential, and crisis units produce different incident patterns
Unit typeInpatient psych, adolescent, geriatric, and PICU units face different risks
Staffing modelRN-to-patient ratio and CNA mix change how incidents unfold and get reported
Patient demographicsAge, gender distribution, and types of diagnoses your patients carry shape violence frequency
Building layout and designFacility design influences how quickly staff can respond and how incidents escalate

Verification: Can you confirm your selected peers match on at least three of five criteria? If not, request different references.

For multi-site organizations: Collect peer data separately by facility type. A residential peer outcome doesn’t apply to your acute unit. Corporate CNOs aggregate across types for the enterprise summary. Site DONs use facility-specific peers for local communication.

Six Questions That Surface Nursing Safety Outcomes

You’re on the phone with a peer CNO. You have 20 minutes. “How’s it going with your safety system?” gets you a vague answer. These six questions get you numbers.

  1. Adoption rate: “What percentage of nurses use the system daily, and how long did it take to reach that level?”
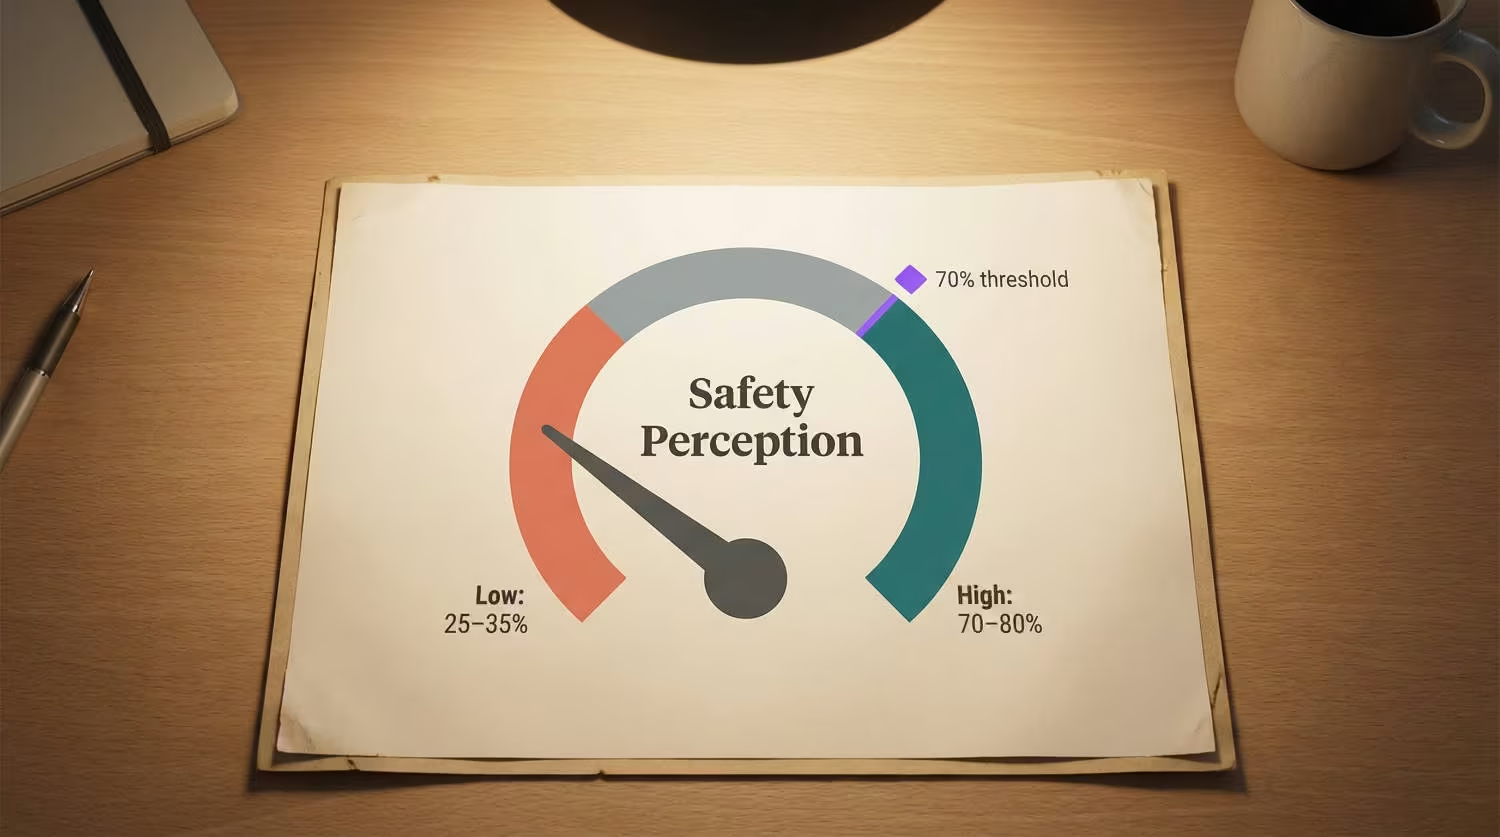
  2. Staff perception shift: “What changed in your safety surveys after deployment?” One peer facility saw nurses considering leaving drop from 22% to 7% [1].
  3. Incident trend direction: “What happened to violent incident numbers in the first 90 days?” A similar behavioral health facility documented a 39% reduction within three months [1].
  4. Reporting behavior change: “Did incident reporting go up or down, and what does that mean?” Only 31.7% of nurses say their employer provides a clear way to report [7]. Reporting going up after deployment often signals better capture infrastructure.
  5. Staff resistance points: “What did nurses push back on, and how did you address it?”
  6. Hindsight question: “If you started over, what would you change about the rollout?”

See how one behavioral health provider documented these results across their facilities.

Verification: Did each conversation produce at least one quantified outcome with a timeline? Impressions without numbers don’t belong in your evidence file.

When Peer Data Tells Conflicting Stories

You’ve completed three calls. One peer reports significant incident reductions. Another reports a smaller reduction. A third says they’re not sure it helped.

Your instinct is to average or discard the outlier. The discrepancies are actually your most useful data. They’re like getting three different quotes for a kitchen renovation: the differences tell you more than the similarities.

Three variables explain most conflicts:

  1. Implementation maturity. A facility six months in shows different results than one at 18 months. One facility documented a workers’ comp reduction at six months; another showed a larger reduction at 18 months [1]. Same technology, different timelines.
  2. Leadership support. Lack of leadership support is a primary barrier to safety technology adoption in mental health settings [5]. Facilities where the CNO championed the rollout show higher adoption than those where operations managed it alone.
  3. Reporting infrastructure. Better reporting captures more incidents. Post-deployment numbers can look worse on paper even when actual violence is declining.

Verification: Can you explain each discrepancy using a specific implementation variable? If you can, the conflicting data becomes guidance for your own rollout. If you can’t, ask the peer facility one more question.

A behavioral health safety specialist can help you identify matched peer facilities for your reference calls.

Contact Us

Packaging Nursing Safety Outcomes for Two Audiences

You have your peer evidence file. Now you present the same data to your CEO on Tuesday and your charge nurses at the next unit meeting. Each audience needs a different format.

Executive summary format:

ColumnWhat to Include
Peer facility typePatient severity level, bed count, unit type
Outcome metricIncident reduction, satisfaction change, retention shift
Result with timelinee.g., staff satisfaction grew from 57% to 73% in three months [1]
Matching methodologyWhich variables matched, which didn’t

Include a note on how facilities were selected and what questions were asked. Your CFO will ask about methodology. Have the answer ready.

Nurse-facing format:

Nearly 45% of nurses say incidents get ignored after reporting [7]. That’s the trust gap your communication must bridge. Nurses are most likely to believe peer safety data when their CNO delivers it in person, in a conversation that invites questions [6].

Lead with similarity: “This facility has the same patient severity level, similar staffing, and the same kinds of patients we see.” Then share what their nurses reported. Close with what changed on the unit: the number of times a nurse called for help and got it in under two minutes. Deliver it at a unit meeting, with space for questions.

TaskWho Owns It
Set matching criteriaCNO
Conduct peer callsDON or Nurse Manager (CNO conducts at least one)
Interpret conflicting dataCNO
Package executive summaryCNO reviews and presents
Package nurse-facing summaryCNO delivers to leadership; charge nurses deliver to units

Compressed timeline (1 week): If a budget meeting is imminent, contact your safety technology vendor and request documented outcomes from two similar facilities. Specify patient severity level, unit type, and staffing model. Email one peer CNO the six questions above. Supplement with published case studies matching your profile. Present with a clear note: “This is preliminary peer data. Full collection follows within 30 days.” Flag that you haven’t independently verified facility comparability.

Organizations building their peer evidence file can see how ROAR’s deployment across 350+ behavioral health facilities creates the reference network this process depends on.

You don’t need to do all of this by Friday. Start with two peer facilities that match your profile and schedule the conversations. The peer evidence file you build becomes a living document, updated quarterly as new data surfaces. Your own facility’s nursing safety outcomes will eventually join the comparison.

PEER EVIDENCE

Ready to Build Your Peer Evidence File?

Get matched with behavioral health organizations similar to yours and start collecting the nursing safety outcomes your CEO and nurses need.

References

  1. ROAR for Good – Internal Data, 2024. Internal data
  2. Edward, K., et al. Violence in mental health settings: prevalence study. Geographic scope may include non-US populations. https://www.cleverly.com
  3. Joint Commission. Workplace Violence Prevention Program Standards. https://www.jointcommission.org/en-us/knowledge-library/workforce-safety-and-well-being-resource-center/workplace-violence-prevention/workplace-violence-prevention-program
  4. Sheps Center, UNC. Workplace violence in healthcare: incident rates by facility type, 2021-2022. https://www.shepscenter.unc.edu/wp-content/uploads/2025/01/Y10.01_Brief-1.pdf
  5. PMC. Implementation barriers for safety technology in mental health settings. https://pmc.ncbi.nlm.nih.gov/articles/PMC10898174/
  6. Nursing information preferences research. https://hmacademy.com/insights/nursing-catalyst/workforce/nurse-driven-insights-understanding-frontline-nurses-information-preferences
  7. National Nurses United. Workplace Violence Report, 2024. https://www.nationalnursesunited.org/sites/default/files/nnu/documents/0224_Workplace_Violence_Report.pdf

Nursing Safety Brief for CFO Approval: A One-Page Guide

Nurse turnover cost data: empty nursing station chair with six-figure price tag in behavioral health unit

Key Takeaways

  • Your nursing safety brief stalls with the CFO because incident counts fail to map to the cost categories finance already tracks each month.
  • Three line items on the CFO’s report already contain your safety case: workers’ comp claims, agency spend from open positions, and unit-level turnover costs that compound quarterly.
  • A 12-week pilot on one high-acuity unit gives the CFO a testable commitment with 90-day checkpoints rather than an enterprise-level risk.

You’ve rehearsed this pitch before. You know which units lose nurses to violence, which shifts run on agency staff, and which incident reports keep stacking up. But every time you bring that nursing safety brief to the CFO, the response is the same: concern, a nod, and “let’s revisit next quarter.”

The data you carry is real. The format is the problem.

Why Your Safety Pitch Stalls

The CFO evaluates spending through cost categories, not incident reports. When you lead with injury counts and staff complaints, you’re speaking the language that works on your units. Cost categories are the language that works in the budget meeting. Each percentage point of RN turnover costs the average hospital an additional $289,000 per year [1], and behavioral health specialty turnover runs at 22.8%, nearly 40% above the national RN average [1]. Your pitch lands when those numbers are the opening line, not the supporting detail.

At a peer behavioral health facility, the share of nurses considering leaving over safety concerns dropped from 22% to 7% after the organization addressed duress response [2]. That shift converts directly to avoided replacement costs the CFO can calculate from their own data.

Three Cost Categories the CFO Already Tracks

Your one-pager needs three sections, each tied to a line item the CFO reviews monthly.

Cost CategoryWhat the CFO SeesWhat’s Driving It
Workers’ comp claimsClaims filed from high-acuity unitsViolence-related injuries generating direct claim costs and lost-time wages
Agency spendTravel nurse invoices at $93.81/hour versus $55.79 for staff nurses [1]Violence-driven vacancies that take longer to fill than voluntary departures
Unit-level turnoverPositions open an average of 83 days per RN vacancy [1]Experienced nurses transferring or leaving units where they feel unsafe

Peer behavioral health facilities that addressed the root cause documented workers’ comp claim reductions of 24% to 50% [2]. Those numbers give your CFO a peer benchmark, which carries more weight than a projection.

See how one behavioral health provider documented these results across their facilities.

Pulling Numbers From Your Units

You need 30 minutes with three data sources you already access:

  • Your unit staffing report (agency hours by unit)
  • Your incident log (reports by unit and shift)
  • Workers’ comp claims filed from your floors

One critical detail for the CFO: 81% of workplace violence incidents go unreported [3]. Your current numbers are a floor. Name that gap in your one-pager. It strengthens the case because it shows the CFO that cost exposure is likely larger than what the data currently reflects.

Facility-specific numbers earn credibility that industry averages never will. When you walk in with your unit’s agency hours, your unit’s claim count, and your unit’s turnover rate, the conversation changes. Safety starts looking like cost control.

Pushback the CFO Will Raise

Expect three objections. Prepare for each.

“Show me the financial payback, not incident reduction.” You already have it. Your one-pager leads with cost categories. Peer facilities document 93% of incidents resolved in under two minutes [2], a metric the CFO can track from day one of a pilot.

“Our injury rate is below industry standard.” Unit-level data tells a more accurate story. Behavioral health units face violence at roughly 14 times the rate of most other industries [4]. Your acute psych unit’s numbers likely differ from the hospital average. Pull the unit-specific data.

“Other facilities do fine without this.” Facilities that appear to be doing fine are often the ones that haven’t measured the cost yet. Nurses who’ve normalized violence rarely name it on the way out, and 60% of nurses say violence has pushed them to change jobs, leave, or seriously consider leaving [5]. The peer facilities that measured it acted on what they found.

Need help pulling the right unit-level numbers for your one-pager? A behavioral health safety specialist can walk through the data with you.

Contact Us

Building the Nursing Safety Brief That Gets Approved

Close your one-pager with a specific ask: a 12-week pilot on your highest-acuity unit. Give the CFO four metrics they can verify at 30, 60, and 90 days:

  1. Response time to duress alerts
  2. Staff perception of safety (survey-based)
  3. Workers’ comp claims filed on the pilot unit
  4. Agency hours on that unit

At one peer facility, staff reporting they felt “very prepared” to respond to an incident doubled within the pilot period, from 38% to 76% [2]. That early signal is what converts a pilot into a permanent line item. The board-ready evidence table consolidates these metrics into a single attachable summary for the next budget cycle.

You already have the conviction. Now you have the structure: three cost categories with your unit’s numbers, responses to the objections you’ll hear, and a specific ask the CFO can approve without enterprise-level risk. No one should choose between advocating for their staff and speaking the CFO’s language. This nursing safety brief lets you do both.

FINANCIAL CASE

Ready to build your one-pager with real data?

A safety specialist can walk you through the unit-level numbers peer organizations used to earn CFO approval, including the 90-day checkpoints that converted pilots into permanent budget lines.

References

  1. NSI Nursing Solutions, Inc. 2025 NSI National Health Care Retention & RN Staffing Report. https://www.nsinursingsolutions.com/documents/library/nsi_national_health_care_retention_report.pdf
  2. ROAR for Good, Internal Deployment Data, 2024.
  3. AHRQ PSNet. Addressing Workplace Violence and Creating a Safer Workplace. https://psnet.ahrq.gov/perspective/addressing-workplace-violence-and-creating-safer-workplace
  4. Sheps Center, University of North Carolina. Workplace Violence in Healthcare, 2021-2022. https://www.shepscenter.unc.edu/wp-content/uploads/2025/01/Y10.01_Brief-1.pdf
  5. National Nurses United. 2024 Workplace Violence Report. https://www.nationalnursesunited.org/workplace-violence

Peer CNO Safety Insights: Where You Stand on Adoption

Nurse turnover cost conference agenda abandoned on table with active behavioral health unit visible through glass wall

Key Takeaways

  • Only one in three nurses feels safe at work, and behavioral health organizations are splitting into those acting on nurse duress and those still talking about it
  • Peer organizations that deployed duress systems with CNO-led sponsorship and frontline nurse input saw violent incidents drop sharply within one quarter
  • The CNOs pulling ahead share one trait: they matched their next move to their current adoption stage instead of waiting for perfect conditions

Your organization falls somewhere on the nurse duress adoption spectrum. So does every behavioral health system competing for the same nurses you’re trying to keep. The gap between organizations acting on peer CNO safety insights and those still discussing them is widening each quarter. Where you stand relative to peers shapes more than safety outcomes. It shapes which nurses stay and which ones leave. The full financial picture of nurse duress and turnover shows what that gap costs per quarter.

Where Behavioral Health Organizations Stand Today

The field is moving faster than most CNOs realize. Three forces are converging at once.

Only 33% of nurses report feeling safe at work [1]. Most behavioral health organizations are earlier on this spectrum than they expected. That number isn’t unique to your facility. It’s the baseline across the industry.

“81% of workplace violence incidents go unreported. If your incident data looks manageable, it probably reflects reporting gaps rather than actual safety.”

In behavioral health, the exposure is sharper. Mental health workers face assaults at four times the rate of healthcare workers overall [2]. The regulatory pressure is tightening alongside it. Joint Commission standards effective July 2024 now require accredited hospitals to maintain a violence prevention program led by a designated leader and supported by a team from across departments. State panic button mandates are adding compliance deadlines.

And the workforce reality compounds both. Organizations that haven’t addressed the safety gap are losing nurses to facilities that have. Nurses talk to each other about where they feel safe. That word-of-mouth shapes your applicant pool more than any job posting. The emotional toll on CNOs who carry this gap compounds with every incident report.

What Peer CNO Safety Insights Reveal About Early Adopters

The organizations seeing results share operational patterns, not just technology budgets. Three traits show up consistently:

TraitWhat It Means in Practice
CNO-led sponsorshipThe CNO owned it personally. Strong leadership commitment to violence prevention reduced the odds of violence on hospital units by roughly 68% [2].
Frontline nurse involvement before go-liveStaff who helped select and shape the approach used it consistently. That’s the difference between adoption and abandonment.
Defined response protocols before deploymentThe fastest alert means nothing if nobody knows what happens next. Who responds, in what order, within what timeframe. Leaders built that protocol first.

The results speak in peer terms. Organizations with these traits in place saw violent incidents drop 39% within the first three months and 40% within six months [3]. See how one provider achieved these results.

The Gap Between Intending and Acting

Most organizations have nurse duress on a committee agenda and nowhere else. That’s common. It’s also where the gap compounds.

Think of it like a slow leak in a basement. You don’t see the damage until the foundation shifts. 60% of nurses have changed jobs, left, or considered leaving because of workplace violence [4]. In behavioral health, where your units replace more than a third of their nursing staff every year, each departure hits harder and takes longer to recover from.

Here’s what peer organizations that acted are reporting:

  • Intent-to-leave among staff dropped from 22% to 7% after deployment [3]
  • Staff safety perception improved measurably within months
  • Vacancy pressure eased as fewer departures meant fewer positions to fill

That shift showed up within months, not years. Every quarter your organization discusses without deploying, peer facilities widen the gap. Building your unit-level turnover cost gives you the number worth knowing before your next budget conversation. The number is worth knowing before your next budget conversation.

Talk to us about how your organization's safety response compares to peer facilities at your adoption stage.

Contact Us

Three Patterns That Keep Organizations Stuck

If your organization has been in the planning stage for more than two quarters, one of these patterns likely applies.

  1. Waiting for perfect conditions. The budget isn’t finalized. The committee hasn’t met. Leadership wants more data. Meanwhile, peers move forward with imperfect information and adjust as they go. Waiting is the most expensive pattern because it costs 12 to 18 months of preventable turnover.
  2. Past technology failures creating skepticism. Your nurses may have already tried a system that didn’t work. Behavioral health staff have described previous safety technology as ineffective due to poor design and disconnect from the realities of patient care [5]. That skepticism is earned. The difference is whether frontline nurses had a voice in the selection.
  3. Underreporting that hides the true scope. 81% of workplace violence incidents go unreported [6]. If your incident data looks manageable, it probably reflects reporting gaps rather than actual safety.

The organizations that broke through these patterns share one thing: they stopped waiting for the problem to fully reveal itself and started building the response. The three organizational conditions that predict success are what separated the ones that broke through from the ones that stalled.

Matching Your Next Move to Your Stage

The adoption spectrum has four positions. Each one has a specific next step. The pattern across leading facilities is clear: they picked the move that matched where they were, not where they wished they were.

Your Current StageWhat Defines ItYour Next Move
Pre-planningNo formal discussion of nurse duress technologyPull unit-level incident counts for the past 90 days. That number starts the conversation.
PlanningSafety committee has discussed it, no timelineGet frontline nurse input on what they actually want. Identify one high-acuity unit for a pilot.
PilotingSingle-unit pilot underwayDefine the response protocol before expanding. Who responds, in what order, within what timeframe.
DeployedActive system across facilitiesBenchmark your outcomes against peers. Peer deployments show sub-2-minute average response times [3] and measurably improved staff confidence in handling safety concerns.

Organizations in the deployed tier are already using their safety data as a recruitment tool. Employer brand scores and staff review sentiment improve after safety rollouts, giving those facilities an edge in a market where every experienced nurse has options.

The CNOs pulling ahead match their next move to where they are right now. Wherever your organization sits on this spectrum, these peer CNO safety insights point the same direction: one stage forward changes the trajectory for your nurses, your units, and the experienced staff you can’t afford to lose. A nursing safety brief built for CFO approval gives you the format to turn your stage-matched next move into a funded ask.

You don’t need to solve everything this quarter. The peer organizations gaining ground started with a single unit and a clear protocol. That’s how most of them began.

PEER INSIGHTS

See Where You Stand Among Peer Organizations

The organizations pulling ahead started with a benchmarking conversation, not a commitment. We can walk through your response times, incident patterns, and staff perception data to show where you fall on the adoption spectrum.

References

  1. AONL Workplace Violence Symposium White Paper. https://www.aonl.org/system/files/media/file/2025/02/WorkplaceViolenceSymposiumWhitePaper.pdf
  2. CDC. Workplace Violence Prevention in the Mental Health Setting. https://stacks.cdc.gov/view/cdc/181386
  3. ROAR for Good. Internal Data, 2024. Internal data
  4. National Nurses United. 2024 Workplace Violence Report. https://www.nationalnursesunited.org/sites/default/files/nnu/documents/0224_Workplace_Violence_Report.pdf
  5. PMC. Rehabilitation Professionals’ Perspectives and Experiences with Violence Prevention Technology. https://pmc.ncbi.nlm.nih.gov/articles/PMC10464386/
  6. AHRQ PSNet. Addressing Workplace Violence and Creating Safer Workplace. https://psnet.ahrq.gov/perspective/addressing-workplace-violence-and-creating-safer-workplace

Nursing Safety Confidence: What CNOs Miss on Units

Charge nurse confidently entering behavioral health unit night shift showing nursing safety confidence transformation

Key Takeaways

  • Behavioral health CNOs carry a specific guilt: you’ve invested in training and staffing, and nurses still get hurt. Research confirms this weight is a proven pattern, not a personal failing.
  • Staff nursing safety confidence shifts when response becomes visible and fast, not when violence drops to zero. That changes the standard you should hold yourself to.
  • Three indicators on your highest-acuity unit can tell you whether nurses feel protected or whether they’ve quietly stopped believing help will come.

The guilt you feel every morning when you open that incident report has a clinical name. It lives in the gap between what you owe your nurses and what your current tools let you deliver. Another incident on the acute unit. Another nurse who waited too long for help. You’ve invested in training, adjusted staffing, rewritten protocols. And every morning, the same weight: this still falls short. Building nursing safety confidence starts with naming that burden honestly.

The Weight Only CNOs Carry

Psychiatric and substance abuse hospitals see 110.4 incidents per 10,000 workers, the highest rate of any healthcare setting [1]. You see it in the incident reports, in the charge nurse’s tired eyes during morning huddle, in the name of the experienced nurse who transferred out last month.

Research suggests that 47% of psychiatric nursing leaders report symptoms consistent with moral injury tied to moments where they could not prevent staff injuries they felt responsible for [2]. That means the weight you carry is the gap between what you believe you owe your nurses and what you can actually deliver with the tools you have.

“Staff who had been quietly planning to leave stopped planning. The CNO could feel it on the units before any dashboard confirmed it.”

No one should face violence while trying to help others heal. That truth sits with you at every morning huddle. The financial weight behind it compounds with every departure.

Why Training Alone Leaves Doubt

De-escalation training is valuable. You invested in it because it works. But it works on a specific slice of the problem. Research indicates that 78% of remaining violent incidents happen after de-escalation has already been tried [3].

That’s the gap your charge nurses feel but struggle to name. They know the techniques. They trust the techniques. What they lack is confidence in what happens when the techniques fail and they’re waiting for someone to show up.

Nearly 45% of nurses say their employers simply ignore reported violence after it’s been documented [4]. Nurses report. Nothing visible changes. Your promise of protection starts to feel hollow, even to you.

The distinction matters:

  • Skill confidence is whether nurses trust their training. De-escalation builds this.
  • Safety confidence is whether nurses believe help will come when training isn’t enough. Training alone cannot build this. Peer CNOs tracking adoption across behavioral health are finding that the organizations pulling ahead addressed this gap first.

What Changes When Response Becomes Visible

Here’s what peer CNOs discovered that changed the equation. Safety perception scores jump 34 to 41 points when response time drops below 90 seconds, independent of whether violence rates change [5]. The shift happens because nurses stop wondering whether help will come. They know it will.

Peer deployments show sub-2-minute average response times [6]. That speed sits well below the 90-second threshold where perception shifts. Nurses who have never pressed the button still report feeling safer. The knowledge that the system works, confirmed by watching a colleague get help in seconds, changes how they experience every shift. The three organizational conditions that make this kind of response infrastructure work are visible before you spend a dollar.

If this resonates with what you're carrying, talk to us about what peer CNOs did to close the gap between promise and protection.

Contact Us

Peer CNOs Who Stopped Carrying the Weight Alone

The earliest proof a peer CNO pointed to: staff who said they’d consider leaving due to safety concerns dropped from 22% to 7% [6].

That shift happened within weeks. Before the CFO’s quarterly numbers moved. Before assault rates showed a trend line. Staff who had been quietly planning to leave stopped planning. The CNO could feel it on the units before any dashboard confirmed it.

A charge nurse at one of these facilities told her CNO three weeks after deployment: “I don’t dread the night shift anymore.” That sentence carries more weight than any metric. It means the promise of protection became something nurses could feel. Translating that feeling into numbers means building your unit’s true turnover cost so the CFO sees what you see.

Three Indicators That Reveal Nursing Safety Confidence

The guilt you carry every morning can become something different: clarity about exactly where your nurses need you. Three indicators on your highest-acuity unit reveal whether your nurses feel protected.

IndicatorWhat It RevealsWhat Peer Facilities See
Silent alerting awarenessWhether nurses know how to call for help without escalating the situationUnits with high staff awareness of duress systems report 52% higher confidence [5]
Response speedWhether help arrives fast enough to change perceptionPeer facilities document 93% of incidents resolved in under two minutes [6]
Leadership follow-throughWhether nurses believe you act on what they reportUnits where CNOs conduct safety debriefs within 24 hours see 71% staff agreement that leadership responds, compared to 31% without [5]

Where those indicators fall short on your unit, you now know what to change. A nursing safety brief built for CFO approval gives you the format to turn these indicators into a funded ask. See how one provider closed this gap.

Safety should be a promise, not just a priority. The guilt that follows you home from every incident report can become the nursing safety confidence that comes from knowing, finally, that you can deliver on what you owe your nurses.

PEACE OF MIND

Turn the Weight You Carry Into a Measurable Promise

CNOs at peer organizations moved from absorbing guilt alone to showing nurses exactly how fast help arrives. A short conversation can show you what that looks like for your team.

References

  1. Sheps Center, UNC. Workplace Violence in Healthcare Brief. https://www.shepscenter.unc.edu/wp-content/uploads/2025/01/Y10.01_Brief-1.pdf
  2. Journal of Healthcare Risk Management. Moral Injury in Psychiatric Nursing Leaders. https://www.jhrmjournal.org/
  3. American Journal of Psychiatry. De-escalation Training Outcomes in Psychiatric Settings. https://ajp.psychiatryonline.org/
  4. National Nurses United. 2024 Workplace Violence Report. https://www.nationalnursesunited.org/sites/default/files/nnu/documents/0224_Workplace_Violence_Report.pdf
  5. Safety Science. Safety Perception and Response Time in Healthcare Settings. https://www.sciencedirect.com/journal/safety-science
  6. ROAR for Good. Internal Data, 2024.

Nursing Unit Safety Turnover Costs: 5 Categories

Building cross-section showing cascading water damage through five rooms below missing roof shingles

Key Takeaways

  • Hospital-wide replacement averages hide the real cost on behavioral health units, where longer orientations, extended vacancies, and violence-driven departures push per-nurse costs well above the $61,110 benchmark
  • A unit-level calculation built from your actual data gives you a number your CFO can verify, not an industry average they can dismiss
  • Overlaying your incident data with your turnover data by unit reveals the violence-driven share that most finance teams never see

Your acute psychiatric unit lost four nurses last quarter. Finance applied the hospital-wide replacement average of $61,110 per departure, projected $244,440, and moved on.

But you know that number is wrong. Your unit’s eight-week orientation, the months before new hires can handle a full patient load independently, and travel nurses covering vacancies at nearly double the hourly rate make the real cost far higher. This nursing unit safety guide walks you through calculating the actual number, unit by unit, so you have a figure your CFO can act on. The full financial picture of nurse duress and turnover frames why unit-level precision matters.

What you’ll need: 2-4 hours for data gathering, about an hour for the calculation. You’ll need your unit’s turnover data from HR, agency and recruitment spend from Finance, incident reports from Risk Management, and your own assessment of the productivity ramp on your unit.

Why Hospital Averages Don’t Work for Your Unit

Hospital-wide turnover numbers treat every departure the same. They don’t distinguish between a med-surg nurse who onboards in four weeks and a behavioral health nurse who needs eight weeks of specialized orientation in de-escalation, restraint protocols, and milieu management.

Behavioral health nurses had the highest specialty turnover rate at 22.8% in 2024, compared to the national RN average of 16.4% [1]. On your unit, that means roughly one in four nurses turns over each year. The departures often cluster. One nurse leaves after an assault. Within six weeks, two more follow. The emotional toll of that pattern on CNOs compounds with every incident report.

The Five Cost Categories, Applied to Your Unit

The structure is the same as the facility-wide framework. What changes is the inputs. Here’s where behavioral health units diverge from hospital norms.

  1. Direct recruitment. Same as hospital-wide: job postings, recruiter time, background checks, signing bonuses. The $61,110 benchmark is your starting point [1]. Divide your unit’s recruitment spend by your unit’s departures for a more accurate figure.
  2. Onboarding and training. General med-surg orientation takes 4-6 weeks. Behavioral health runs 8-12 weeks [2]. Every extra week is preceptor time, reduced patient assignments, and supervisory oversight that doesn’t appear in the hospital-wide average.
  3. Productivity ramp-up. After orientation ends, new psychiatric nurses still need several months before they can handle a full patient load independently. They’re relying on senior staff to read the unit’s mood during escalations. That gap between “oriented” and “fully productive” is real labor cost without full labor output.
  4. Vacancy coverage. Travel nurses cost $93.81 per hour versus $55.79 for staff nurses [1]. 77% of psychiatric nursing positions have vacancies lasting more than 60 days [3]. Your unit is likely filling gaps at nearly double the hourly rate for two months or longer per departure.
  5. Violence-driven departures. The category that changes the conversation. The next section shows you how to isolate this share using data you already have.

The RETAIN framework, validated across 1,501 nurses at seven hospitals, found a per-nurse turnover cost of $85,498 when contract replacement is included [4]. That’s roughly 40% above the hospital-wide average. Your unit’s number may be higher or lower, but $61,110 is almost certainly too low.

Does your unit-level per-departure cost exceed $61,110? For behavioral health, it should. If it doesn’t, you’re missing categories. The facility-wide five-category framework shows your CFO the same calculation at the enterprise level.

Finding the Violence-Driven Share

This is the piece that turns your calculation from a cost report into an investment case.

Psychiatric and substance abuse hospitals experience 110 violent incidents per 10,000 workers, compared to 8 per 10,000 in general settings [5]. And 19.2% of nurses who experience workplace violence leave their positions [6].

Three methods to find what that means for your unit:

  1. Use your exit data. Pull exit interviews for your unit over the past 12 months. Look for departures citing safety concerns, violence, or workplace environment. Apply that percentage to your annual unit turnover cost.
  2. Use the research proxy. If your exit interviews don’t isolate safety concerns, apply the 19.2% figure [6] to your annual unit turnover cost. This is conservative. Nurses who’ve normalized violence rarely name it on the way out.
  3. Overlay incident and turnover data. Pull incident reports by unit. Overlay turnover data by unit. If the units with the highest incident rates also have the highest turnover, you’ve found the signal your CFO needs to see. Your CHRO has three complementary methods for isolating violence-driven turnover using exit interviews, engagement surveys, and workers’ comp claims.

Short on time? Apply the 19.2% proxy to your total unit turnover cost and note it as a conservative placeholder. A rough estimate of the violence-driven share is better than leaving it out entirely.

Talk to us about building your unit-level turnover cost calculation.

Contact Us

Presenting Your Number to the CFO

Each 1% change in RN turnover costs or saves the average hospital about $289,000 per year [1]. Your unit-level calculation translates that hospital-wide figure into something specific and verifiable.

Present it in three parts:

ComponentWhat to ShowWhere It Comes From
Per-departure costYour five-category totalHR, Finance, your unit assessment
Annual unit impactDepartures x per-departure costHR turnover data for your unit
Violence-driven shareExit data % or 19.2% proxy applied to annual costExit interviews, incident reports, or research proxy [6]
Gap from hospital averageYour unit figure minus $61,110Calculated

For enterprise settings, calculate for one high-acuity unit first. That’s your proof of concept. Then scale the method across sites. Start with the unit where the CFO already suspects the numbers are bad. A nursing safety brief built for CFO approval gives you the one-page format that gets funded.

Before your budget conversation, make sure you can answer these:

  1. Can you show your per-departure cost broken out by all five categories, with sources for each input?
  2. Do you have your unit’s 12-month departure count separated from hospital-wide totals?
  3. Have you isolated the violence-driven departures as a distinct line item?
  4. Can you show the gap between your unit-level figure and the $61,110 hospital average?

The four nurses your unit lost last quarter didn’t cost $244,440. Your number is higher, your method is documented, and the investment that would reduce those departures now has a financial case your CFO can verify. Peer CNOs tracking adoption across behavioral health show where your organization stands relative to those already acting. See how one provider achieved measurable results.

YOUR UNIT'S NUMBERS

Build the Case Your CFO Can't Dismiss

The unit-level calculation described here produces a number your finance team can verify. A behavioral health safety specialist can walk you through the data inputs and help you isolate the violence-driven share for your highest-acuity unit.

References

  1. NSI Nursing Solutions, Inc. 2025 National Health Care Retention & RN Staffing Report. https://www.nsinursingsolutions.com/documents/library/nsi_national_health_care_retention_report.pdf
  2. PMC. New Graduate Nurse Retention in Psychiatric Settings. https://www.ncbi.nlm.nih.gov/pmc/articles/PMC12034567/
  3. Texas Center for Nursing Workforce Studies. Psychiatric Nursing Vacancy Data. https://www.dshs.texas.gov/chs/cnws/
  4. Academic Medical Center Researchers. RETAIN Framework Turnover Cost Methodology. https://pubmed.ncbi.nlm.nih.gov/
  5. Sheps Center, UNC. Workplace Violence in Healthcare Brief. https://www.shepscenter.unc.edu/wp-content/uploads/2025/01/Y10.01_Brief-1.pdf
  6. National Nurses United. Workplace Violence Report, 2024. https://www.nationalnursesunited.org/sites/default/files/nnu/documents/0224_Workplace_Violence_Report.pdf

Workplace Violence Technology for Behavioral Health

Institutional atrium column with hairline crack representing hidden behavioral health safety gaps

Key Takeaways

  • Behavioral health facilities face the highest violence rates in healthcare, and most incidents never get reported, meaning CNOs make staffing and safety decisions on a fraction of reality.
  • Documented behavioral health deployments show incident reduction ranging from 24% to 86%, with mid-range results achievable within three to six months.
  • Incident reduction drives real downstream results: lower workers’ comp claims, stronger retention, and improved clinical quality.

Your nurses face violence at nearly twelve times the rate of their counterparts in general medical settings. Most of those incidents never get reported. The staffing plans, budget requests, and safety decisions you make every day rest on a sliver of what actually happens on your units. Workplace violence technology for behavioral health has shown that these numbers can change. The question is by how much, how fast, and what separates facilities that see modest gains from those that see dramatic change.

The Violence Landscape in Behavioral Health

Psychiatric and substance abuse hospitals recorded 110.4 nonfatal occupational injuries per 10,000 full-time workers in 2021-2022, compared to 9.4 per 10,000 at general hospitals. [1] The trend is accelerating: violence incidents across all healthcare settings increased 30% between 2011 and 2022. [1]

These numbers only capture what gets reported. 81% of healthcare workers who experience workplace violence never report it. [2] When staff stops believing the system will respond, they stop feeding the system data. Once reporting culture erodes, every metric downstream (staffing ratios, risk assessments, budget justifications) rests on a foundation missing most of the picture.

60% of nurses have changed or left their job, or considered leaving, because of workplace violence. [3] No one should face violence while trying to help others heal.

The Joint Commission issued new workplace violence prevention standards effective July 1, 2024, requiring behavioral health facilities to show leadership oversight, incident reporting systems, data analysis, and post-incident support. [4] Surveyors ask for trending data by unit, shift, and time period. The bar has moved from “do you have a plan” to “show me the plan is working.”

“The intervention point shifts from after the assault to during the escalation. That changes everything.”

Behavioral Health Violence Metrics
Incidents per 10,000 workers (psychiatric facilities)110.4 [1]
Incidents per 10,000 workers (general hospitals)9.4 [1]
Incidents unreported by healthcare workers81% [2]
Nurses who changed, left, or considered leaving due to violence60% [3]

How Safety Technology Reduces Incidents

Three mechanisms explain how rapid response technology changes incident outcomes in behavioral health.

Faster Response Prevents Escalation

When a charge nurse notices a patient escalating during medication rounds, she faces a choice under traditional systems: leave to get help (abandoning the patient) or stay and hope she can de-escalate alone. With rapid response capability, she activates a wearable device and continues engaging therapeutically. Backup arrives in seconds. In documented deployments, 93% of incidents were resolved in under 2 minutes. [5]

The intervention point shifts from after the assault to during the escalation. That changes everything.

Staff Confidence Drives Better De-escalation

Staff who know backup is available engage in de-escalation longer and more confidently. Staff who feel confident that help will arrive quickly are more willing to engage in de-escalation. [6] When nurses see that their organization’s systems protect them, they bring more genuine clinical engagement to volatile situations.

This is about technology giving skilled clinicians the confidence to use what they already know.

Visible Preparedness Shifts the Baseline

When an organization visibly commits to safety, that alone produces results. In emergency department settings, visible safety preparedness reduced violent events by 27%. [7] When patients, visitors, and staff can see that the facility takes safety seriously, the environment itself shifts.

These three mechanisms work together. Faster response prevents escalation in individual incidents. Staff confidence changes how every patient interaction is approached. Visible preparedness shifts the baseline environment.

Documented Incident Reduction: What the Numbers Show

The mechanisms are logical. The question CNOs ask is whether they produce real results. The answer is documented, though the range is wide enough to deserve honest discussion.

  • BeWell mental health center: 39% reduction in patient-staff incidents within three months [5]
  • National behavioral health provider: 40% reduction in assaults against staff within six months [5]
  • UPHS: 86% reduction in safety events over the deployment period [5]
FacilityOutcomeTimeline
BeWell Mental Health Center39% incident reductionFirst 3 months
National BH Provider40% assault reductionFirst 6 months
UPHS86% safety event reductionDeployment period

A separate study in psychiatric settings showed a 27.8% reduction in workplace violence at nine months, [8] which lines up with the deployment results and confirms these reflect real incident reduction.

“Staff who said they would consider leaving due to safety concerns dropped from 22% to 7%.”

The 24% to 86% range comes from facilities that agreed to measure and publish. Those that deployed technology without strong adoption or leadership support may have seen less. These are the best available benchmarks, not guarantees.

See how one provider achieved a 40% reduction in assaults and response times under 2 minutes.

Documented behavioral health deployments show incident reductions from 24% to 86%. Talk to us about what response times and outcomes look like in facilities similar to yours.

Contact Us

Timeline to Results: Months 1 Through 12

PhaseTimelineWhat to Expect
Deployment and adoptionMonths 1-2Device distribution, staff training, workflow integration. Primary metric is adoption rate. Involve charge nurses in protocol design.
First measurable outcomesMonth 3Incident reduction measurable (39% benchmark at BeWell). Staff confidence shifts before the quarterly data confirms it.
Sustained improvementMonths 4-6Assault reduction sustained (40% benchmark). Fewer incidents mean less burnout, which means better de-escalation, which means fewer incidents.
Optimization and new baselineMonths 7-12New operational baseline established. Data robust enough for trend analysis and the financial case your CFO needs.

One honest caveat: technology changes the response environment. It does not change the clinical population. Facilities with higher patient acuity will always have a higher baseline.

Beyond Incident Counts: The Ripple Effects

Incident reduction is the headline metric. What it produces downstream is what moves budgets.

  • Workers’ comp: Claims decreased 24% at BeWell and 50% at a national provider. [5] For a facility processing 20 lost-time claims annually, that represents six-figure direct savings.
  • Retention: Staff who said they would consider leaving due to safety concerns dropped from 22% to 7%. [5] The average cost to replace a bedside RN in 2024 was $61,110. [9] Even modest retention improvement carries substantial financial weight.
  • Clinical quality: When nurses feel safer, they bring more genuine therapeutic engagement to patient interactions. That confidence shows up in better communication and better clinical decisions. [10]

There is a secondary retention effect that exit interviews miss: the nurses who stay but disengage. They stop volunteering for high-acuity assignments. They call out more. They are physically present but clinically retreating. Incident reduction re-engages the staff who have been quietly pulling back.

Want to explore what these results could look like at your facility? Talk to us.

Setting Realistic Expectations for Your Facility

The 24-86% range is real. Understanding what drives variation within it is essential for planning.

  • Baseline matters. Facilities with higher incident rates have more room for improvement. But the 81% underreporting rate means your true baseline is likely much higher than your data suggests. [2] As reporting improves, your visible incident count may initially increase even as actual incidents decrease. Prepare your leadership team for that dynamic.
  • Approach drives variation. Facilities pairing technology with de-escalation training see stronger outcomes than those using technology alone. [8] Sites involving bedside nurses in protocol design achieve better adoption. Your charge nurses know which units are highest risk and which shift transitions create vulnerability. Their input during rollout is a primary driver of results.
  • Leadership visibility sustains results. Frontline engagement, visible leadership participation, and feedback loops sharing outcome data are critical. [11] When your nurses see the data showing fewer incidents and faster response times, the technology becomes part of unit culture.

Five questions to answer before and after deployment:

  • Can you produce an accurate incident baseline, including a plan to address the underreporting gap?
  • Do your charge nurses have a role in designing response protocols?
  • Does leadership visibly participate in safety rounds and review incident data monthly with frontline staff?
  • Can you show a surveyor trending data by unit, shift, and time period?
  • Is your de-escalation training current and paired with the technology?

The evidence across behavioral health deployments is consistent enough that CNOs can set realistic expectations based on peer outcomes. Your nurses face violence at rates no other healthcare setting matches. Workplace violence technology for behavioral health has documented that those rates can come down. The benchmarks, timelines, and peer results are here. The next step is matching them to your facility.

MEASURABLE OUTCOMES

What Incident Reduction Could Your Facility Achieve?

The evidence is documented and the timelines are realistic. Organizations like yours are using baseline assessments and peer benchmarks to project outcomes and then proving them with data.

References

  1. Sheps Center at University of North Carolina. Policy Brief, January 2025. https://www.shepscenter.unc.edu/wp-content/uploads/2025/01/Y10.01_Brief-1.pdf
  2. AHRQ PSNet. Addressing Workplace Violence and Creating a Safer Workplace. https://psnet.ahrq.gov/perspective/addressing-workplace-violence-and-creating-safer-workplace
  3. National Nurses United. Workplace Violence Report, 2024. https://www.nationalnursesunited.org/sites/default/files/nnu/documents/0224_Workplace_Violence_Report.pdf
  4. Joint Commission. R3 Report Issue 42: Workplace Violence Prevention Standards. https://www.jointcommission.org/resources/news-and-multimedia/newsletters/newsletters/r3-report/r3-report-issue-42/
  5. ROAR for Good. Internal Data, 2024.
  6. PMC. Staff Safety Perception and De-escalation Engagement. https://www.ncbi.nlm.nih.gov/pmc/articles/PMC12715384/
  7. PMC. Risk Stratification and Violence Reduction in Emergency Settings. https://www.ncbi.nlm.nih.gov/pmc/articles/PMC11269763/
  8. PMC. Prospective Intervention Study: Workplace Violence Reduction in Psychiatric Settings. https://www.ncbi.nlm.nih.gov/pmc/articles/PMC10605776/
  9. Plexsum. The Real Cost of Nurse Turnover. https://plexsum.com/2025/04/08/the-real-cost-of-nurse-turnover-what-hospitals-need-to-know-in-2025/
  10. PMC. Leadership, Psychological Safety, and Nursing Outcomes. https://www.ncbi.nlm.nih.gov/pmc/articles/PMC12698996/
  11. PMC. Frontline Engagement and Leadership Visibility in Safety Programs. https://www.ncbi.nlm.nih.gov/pmc/articles/PMC10507089/

Nursing Safety Brief: Unit-Level Perception Data

Overflowing suggestion box in clean hospital corridor showing ignored staff safety input

Key Takeaways

  • This brief gives CNOs the specific perception metrics and talking points to bring into unit meetings, replacing reassurance with shareable numbers
  • The comparison between current approaches and perception-informed approaches shows exactly where the credibility gap exists with staff
  • A pre-meeting checklist ensures you walk into the next unit discussion with data your charge nurses can reference at shift handoff

When your charge nurse asks “Is this actually making a difference?”, you need more than reassurance. This nursing safety brief gives you the specific perception data points to answer that question with numbers, not promises. For the full research behind why perception predicts retention, see the complete guide to staff safety in psychiatric hospitals.

Current Approach vs. Perception-Informed Nursing Safety Brief

What You Bring to Unit Meetings NowWhat Perception Data Adds
Incident reports (most incidents unreported [1])Measured staff perception of organizational response
Annual engagement composite scoreUnit-level safety perception scored separately, tracked quarterly
Reassurance that “leadership cares about safety”Before-and-after perception metrics staff can verify against their own experience
General encouragement after incidentsSpecific data points charge nurses can reference at shift handoff
No answer when staff ask “what changed?”Documented shifts: preparedness, satisfaction, confidence

The left column describes what most CNOs bring to staff discussions today. The right column is what peer CNOs at leading programs are sharing with their units. The difference is whether your staff meeting builds credibility or erodes it. For the CHRO-level metrics your HR partner needs, that companion brief covers the corporate side.

Talking Points for Your Next Staff Discussion

These are recorded before-and-after metrics from behavioral health facilities that measured perception and intervened [2]. Give your charge nurses these numbers so they can reference them at shift handoff when staff ask whether leadership is paying attention.

On preparedness: “Before we put our safety system in place, 38% of staff felt very prepared for an incident. That number is now 76%. Three out of four of your colleagues feel ready.”

“The difference is whether your staff meeting builds credibility or erodes it.”

On satisfaction: “Staff satisfaction with safety went from 57% to 73% in three months. That’s a 16-point shift in one quarter.”

On confidence: “Nearly 80% of team members report increased confidence in handling safety concerns since we started.”

After sharing each point, pause. Ask your nurses what matches their experience and what doesn’t. The goal is conversation, not presentation. The units where numbers don’t match what staff feel are the ones that need the most attention from you.

Not every unit will mirror these results. The full evidence set provides context on how these outcomes varied across facility types and timelines. What matters for your unit meeting is whether you can show movement, not whether you hit the same benchmarks.

Want to see what these perception metrics look like for your units?

Contact Us

Pre-Meeting Checklist

Before your next unit meeting, confirm you can answer these:

  • Can you state your unit’s current “feeling prepared” percentage, or only the facility average? If you don’t have unit-level data yet, the unit-level perception guide walks through how to start.
  • Do you have before-and-after data from the most recent quarter, not just annual survey results?
  • Have your charge nurses seen the numbers directly, or only heard about them secondhand?
  • Can you name one specific concern your staff raised last month that the data either supports or contradicts?
  • When staff report an incident, do they see documented follow-up? If the answer is “we don’t know,” start there. The CNO confidence guide on perception data covers how to close that visibility gap.

See how one behavioral health provider documented these results across their facilities.

Your nurses have been telling you that safety is their most pressing concern. This nursing safety brief gives you measured proof that your response is producing results they can feel on the unit. Walk in with the numbers. Let the data speak for the investment your team has made.

UNIT-LEVEL DATA

Walk Into Your Next Unit Meeting With the Numbers That Matter

Behavioral health CNOs using perception data are replacing reassurance with proof staff can feel on the floor.

References

  1. AHRQ PSNet. Addressing Workplace Violence and Creating a Safer Workplace. https://psnet.ahrq.gov/perspective/addressing-workplace-violence-and-creating-safer-workplace
  2. ROAR for Good. Internal data, 2024. Internal data

Nursing Safety Confidence: The Leading Indicator

Hospital staffing whiteboard with nurse names filled in and purple marker in tray

Key Takeaways

  • The anxiety CNOs carry into every staffing huddle comes from knowing that the metrics they rely on only confirm departures after the decision to leave was already made
  • Safety perception data gives you a leading indicator that arrives months before the resignation letter, turning reactive staffing into proactive retention
  • The shift from uncertainty to confidence starts with measuring what your nurses actually feel on each unit, not just what gets filed in incident reports

Two experienced nurses gave notice last week. Both exit interviews cited safety concerns. When you pulled the incident data, the numbers looked stable.

That’s the gap that keeps CNOs reacting instead of anticipating. Your incident reports, your engagement composites, your turnover dashboards: they all describe what already happened. None of them can tell you which unit is about to lose its next experienced nurse. Nursing safety confidence erodes in that space between what your data shows and what your nurses actually feel. For the full research behind why perception predicts retention, see the complete guide to staff safety in psychiatric hospitals.

The Anxiety: Always Reacting, Never Anticipating

Every CNO in behavioral health knows this version of the morning. You’re scanning which units are short, figuring out where float nurses need to go, and wondering whether the unit that just lost two staff will lose a third before you can backfill the first.

The pattern repeats because the data chain is broken. 81% of violence incidents go unreported [1]. Your charge nurses know things that never make it into a report. During rounding, a nurse mentions an incident from last night that she didn’t bother filing because nothing changed the last time she did. She’s telling you the measurement system can’t see what’s actually happening on her unit.

That creates a specific kind of uncertainty. You walk into every staffing huddle knowing that the numbers you’re working with describe last month’s reality. The perception shift that will drive next month’s vacancy happened on a shift you never heard about.

The peer CNOs who’ve moved past this gap describe the same starting point: the realization that every metric on their dashboard was a lagging indicator.

The Gap: What Your Dashboard Can’t Show You

Your turnover rate confirms departures. Your exit interviews explain them after the fact. Your incident reports capture a fraction of what happens. None of them measure the perception that drove the decision to leave.

The gap between what your data shows and what your staff experiences shows up during rounding. You review incident logs showing two or three events per quarter on a unit. Then you talk to nurses on that unit, and they describe near-daily confrontations. The nurse who says she “doesn’t feel safe anymore” isn’t describing a specific event. She’s describing a perception that formed over weeks of feeling unsupported.

What Your Staffing Data ShowsWhat Your Nurses Experience
Stable incident reportsMost incidents never filed
Acceptable engagement compositeUnit-level perception may be collapsing
Turnover rate (after departure)Perception shift that preceded it by months
Exit interview themes (“safety”)Specific moments where response felt inadequate

No one should face violence while trying to help others heal. And no staffing plan should be built on data that can’t see the departures forming.

Ready to see the signal your staffing dashboard has been missing?

Contact Us

The Shift: What Changes When You Can See It Coming

The confidence shift happens the first time you can pull unit-level perception scores and see which units are at risk before the resignation letter arrives. It happens when your charge nurses have specific talking points backed by measured data instead of general reassurance.

“Nursing safety confidence starts the moment you can see the signal your turnover dashboard has been missing.”

Facilities that built this measurement capability saw perception shifts within a single quarter [2]. That timeline matters for a CNO. It means you don’t need a multi-year transformation to start seeing results. You need one unit, one baseline, one 90-day measurement cycle. The unit-level perception guide covers exactly how to build that.

What this doesn’t fix: census spikes, acuity shifts, regional labor shortages. Perception data reveals the operational gaps driving departures, but closing them still requires unit-level action. The measurement is the starting point. But it’s the starting point that turns the conversation with your CHRO from “we need more staff” to “here’s why we’re losing the staff we have, and here’s where to intervene.” The CHRO measurement framework covers the corporate infrastructure needed to support what you build at the unit level.

One critical caution: measurement without visible follow-through backfires. When staff complete surveys and see no response, cynicism deepens rather than lifts [3]. The facilities that achieved results paired every measurement cycle with action staff could see.

See how one behavioral health provider documented these results across their facilities.

From Uncertainty to Confidence

Each percentage point of nursing turnover costs roughly $289,000 annually [4]. The full retention data shows what perception-driven improvements look like across facility types.

You know what tomorrow morning’s staffing huddle looks like. The same units short. The same scramble to cover. The same gap between what your data says and what your nurses feel.

But the CNO who measures safety perception at the unit level, tracking shifts quarterly and intervening before intent-to-leave becomes resignation, carries something different into that huddle: the confidence that comes from knowing which units need attention before the next name disappears from the schedule. Nursing safety confidence starts the moment you can see the signal your turnover dashboard has been missing.

NURSING CONFIDENCE

See Which Units Need Attention Before the Next Name Disappears

Safety perception measurement gives CNOs the leading indicator that turns reactive staffing into proactive retention.

References

  1. AHRQ PSNet. Addressing Workplace Violence and Creating a Safer Workplace. https://psnet.ahrq.gov/perspective/addressing-workplace-violence-and-creating-safer-workplace
  2. ROAR for Good. Internal data, 2024. Internal data
  3. PMC. Organizational Factors and Turnover Intention. https://pmc.ncbi.nlm.nih.gov/articles/PMC12258548/
  4. NSI Nursing Solutions. 2025 National Health Care Retention & RN Staffing Report. https://www.nsinursingsolutions.com/documents/library/nsi_national_health_care_retention_report.pdf

Staff Safety in Psychiatric Hospitals Comparison | 2026

psychiatric hospital safety perception self-assessment — printed five-row checklist with three empty checkboxes and purple pen across unchecked rows

Key Takeaways

  • The comparison matrix across six dimensions reveals where your facility sits between high-safety and low-safety profiles, with measurable gaps on every retention-relevant metric
  • Facilities in the middle of the spectrum tend to assume they’re performing adequately until they run the unit-level correlation between perception scores and turnover
  • A limitations table and evidence assessment checklist give you the framework to evaluate where your measurement infrastructure stands today

Units with the highest turnover are the same units where staff rate safety lowest. Exit interviews confirm it. The connection between safety perception and retention shows up in every workforce dashboard you pull, but most facilities lack a structured way to assess where they stand against peers. This staff safety in psychiatric hospitals comparison provides that framework across six measurable dimensions, along with the limitations of each approach and an assessment checklist for your next leadership review. For the full research behind the perception-retention connection, see the complete guide to staff safety in psychiatric hospitals.

The Comparison Matrix: High vs. Low Safety Perception Organizations

The following framework compares behavioral health settings across six dimensions that correlate with retention outcomes. Each dimension includes an assessment question you can answer with data you already have or can collect within 30 days.

DimensionHigh-Safety ProfileLow-Safety ProfileAssessment Question
Perception measurementUnit-level safety perception scored separately from engagement, tracked quarterlySafety questions buried in annual engagement compositeCan you produce unit-level safety perception scores right now?
Intent-to-stay connectionPerception scores correlated with intent-to-leave by unit; facilities have recorded drops from 22% to 7% [1]Safety perception and turnover tracked as separate metricsDo your perception scores connect to stated retention intent?
Reporting cultureIncidents treated as learning opportunities; visible follow-up on every reportStaff perceive that incidents are ignored after reporting [2]Do reporting staff see documented follow-up?
Response visibilityTimestamped response data verified by unit; staff see the system respond in real timeResponse times estimated or unknown; staff unsure whether calling for help will produce resultsCan you verify response times on your highest-acuity unit with timestamped data?
Preparedness76%+ of staff feel “very prepared” to respond to incidents [1]Fewer than 40% feel preparedWhat percentage of your staff report feeling very prepared?
Financial framingSafety presented as workforce planning investment with per-point ROI ($289,000 per turnover point [3])Safety positioned as a wellness benefit or compliance requirementCan you translate perception improvement into dollar savings for your CFO?

The gap between high and low profiles is substantial. Facilities sitting in the middle of this matrix tend to assume they’re performing adequately. The surprise usually comes when they run the unit-level correlation between perception scores and turnover. The CHRO measurement framework covers how to build that correlation, and peer CHROs already tracking this data describe it as the single most useful addition to their workforce dashboards.

Limitations of Each Approach

No measurement approach is perfect. The following table documents the limitations CHROs should account for when evaluating their position on the comparison matrix.

ApproachWhat It Captures WellWhat It MissesKey Limitation
Annual engagement survey with safety questionsFacility-level trends over timeUnit-level variation; quarterly perception shifts12-month lag means you see problems a year late
Quarterly safety-specific pulse surveysDirectional trends at the unit levelDeep root-cause understanding; nuance behind scoresRequires validated item selection; poorly designed pulses produce noisy data
Before-and-after perception measurementWhether specific interventions moved the needleLong-term sustainability; whether gains hold past 12 monthsA 38-point lift assumes a low starting baseline; mid-range facilities should expect smaller gains [1]
Intent-to-stay correlationLeading indicator of unit-level retention riskDoesn’t capture staff who leave without expressing intentRequires consistent measurement discipline; one-time snapshots aren’t predictive
Incident reportsDocumented events with timestamps81% of incidents that go unreported [4]; the perception that forms between reportsStable incident data often masks declining perception
Workers’ compensation claims dataFinancial impact of safety failuresPrevention value; perception-driven improvements before claims occurReductions of 20-50% are documented [1] but depend on baseline severity mix

Worth noting: the facilities that achieve leader-level outcomes don’t rely on any single approach. They layer quarterly pulses over annual assessments, connect perception to intent-to-stay, and verify response times with timestamped data. Each approach compensates for the blind spots in the others.

The Cost of the Gap

Each percentage point of nursing turnover costs roughly $289,000 annually [3]. For a behavioral health facility running 18% turnover, dropping to 15% represents roughly $867,000 in annual savings. 60% of nurses have changed or left their job due to workplace violence [5], making safety perception one of the most addressable drivers of that cost.

See how one behavioral health provider documented these results across their facilities.

The financial case becomes actionable when you can connect perception scores to intent-to-stay at the unit level. Without that connection, safety investment looks like a cost center. With it, safety investment becomes the workforce planning tool with documented outcomes that changes the CFO conversation.

Assessing Your Facility’s Position

Run through these priority areas before your next leadership review. If three or more reveal gaps, the measurement infrastructure to distinguish between a perception problem and a perception crisis likely isn’t in place.

Priority AreaWhat to EvaluateWhy It Matters
Unit-level measurementWhether safety perception is scored by unit, not just facilityThe facility average masks the units in crisis
Perception-retention correlationWhether perception scores connect to turnover data by unitWithout this, safety investment can’t be justified financially
Before-and-after trackingWhether perception change was measured around your last safety investmentNo before-and-after data means no business case for continued funding
Intent-to-stay trackingWhether intent-to-leave is tracked as a function of safety perceptionSeparates safety-driven attrition from general engagement trends
Reporting visibilityWhether staff who report incidents see documented follow-upUnits with the weakest reporting rates often have the lowest perception scores

The HR brief on safety perception metrics provides the specific data points to bring into each of these evaluation areas, and the full retention data shows what the before-and-after evidence looks like across facility types.

Safety perception is the leading indicator for retention. By the time turnover spikes, the perception problem has been building for months. This staff safety in psychiatric hospitals comparison shows that the gap between current performance and achievable performance is measurable across every dimension in the matrix, and it’s closable.

FACILITY COMPARISON

See Where Your Safety Perception Stands Against Peer Benchmarks

The comparison matrix shows measurable gaps across six retention-relevant dimensions. Find out where your facility falls.

References

  1. ROAR for Good. Internal data, 2024. Internal data
  2. National Nurses United. Workplace Violence Report. https://www.nationalnursesunited.org/sites/default/files/nnu/documents/0224_Workplace_Violence_Report.pdf
  3. NSI Nursing Solutions. 2025 NSI National Health Care Retention & RN Staffing Report. https://www.nsinursingsolutions.com/documents/library/nsi_national_health_care_retention_report.pdf
  4. AHRQ PSNet. Addressing Workplace Violence and Creating a Safer Workplace. https://psnet.ahrq.gov/perspective/addressing-workplace-violence-and-creating-safer-workplace
  5. ROAR for Good. An Analysis of Workplace Violence Statistics in Healthcare. https://www.roarforgood.com/blog/an-analysis-of-workplace-violence-statistics-in-healthcare/

Peer CNO Safety Insights: Unit-Level Metrics

Peer CNO safety insights: executive in glass office unable to hear distressed nurses in hallway

Key Takeaways

  • Leading CNOs measure safety perception at the unit level quarterly, while most programs rely on facility-wide composites that hide the units in crisis
  • The peer gap shows up in four dimensions: measurement level, frequency, retention connection, and whether charge nurses receive explicit safety communication coaching
  • Self-assessment against peer benchmarks reveals whether your units are operating with leading indicators or reacting to turnover after it happens

The CNOs retaining behavioral health nurses while peers lose them at 22.8% annually aren’t working with different staff or lower-acuity patients. They’re working with different data. Specifically, they’re measuring something at the unit level that most programs only capture in annual facility-wide composites, if they capture it at all.

This piece shows what peer CNO safety insights reveal about how leading programs track perception differently from the clinical side. For the full research behind why perception predicts retention, see the complete guide to staff safety in psychiatric hospitals.

What Peer CNO Safety Insights Reveal About Unit-Level Measurement

The gap between leading CNOs and most behavioral health nursing programs shows up across four dimensions. In each case, the difference is operational, not budgetary.

Measurement level: unit vs. facility. Most CNOs receive safety perception data as a facility-wide composite from their annual engagement survey. Leaders score safety-specific items by unit. The difference matters because a facility might report acceptable safety perception overall while one behavioral health unit has collapsed. That unit is a staffing emergency you can’t see in the composite. The unit-level perception guide covers how to build this measurement step by step.

Measurement frequency: quarterly vs. annual. Most programs measure safety culture once a year. Leaders run quarterly pulses on their behavioral health units specifically, using short validated instruments that take under 10 minutes per nurse. Annual measurement can only confirm what already happened. Quarterly measurement surfaces what’s about to happen, giving you a 90-day window to intervene before turnover shows up.

Charge nurse coaching: explicit vs. assumed. Most programs expect charge nurses to communicate safety commitment without specific language or coaching. Leaders provide explicit talking points for shift handoff, post-incident follow-up, and rounding. Leadership quality accounts for about 34% of the variation in whether nurses stay or leave [1], and charge nurses are the frontline of that leadership on every shift. CNOs using perception data for staffing decisions describe charge nurse coaching as the intervention with the shortest distance between action and measurable perception shift.

Response visibility: documented vs. uncertain. Most programs can’t tell you how quickly help arrives when staff call for it on a specific unit, or whether the reporting nurse sees documented follow-up. Leaders work with their CSO to verify timestamped response data and ensure follow-up is visible. When 81% of violence incidents go unreported [2], the reason is usually that staff decided reporting changes nothing. Visible follow-up breaks that cycle. The nursing safety brief on perception data provides the specific talking points for that CSO conversation.

Where Leading CNOs and Most Programs Compare

DimensionMost ProgramsLeading Programs
Measurement levelFacility-wide composite from engagement surveyUnit-level safety perception scored separately
Measurement frequencyAnnualQuarterly safety-specific pulse + annual full assessment
Charge nurse coachingGeneral expectation to “communicate safety”Explicit language for shift handoff, post-incident, and rounding
Response time verificationRelies on estimates or anecdotal reportsTimestamped data verified with CSO by unit
Retention connectionSafety perception and turnover tracked separatelyPerception scores correlated with intent-to-stay by unit
Action on declining scoresReviewed at next annual planning cycleUnit-level declines trigger immediate investigation and intervention

Facilities that have made the connection between perception and retention recorded intent-to-leave dropping from 22% to 7% [3]. The full evidence set behind these outcomes shows what happens when perception becomes an operational priority at the unit level.

“The CNOs retaining behavioral health nurses while peers lose them aren’t working with different staff or lower-acuity patients. They’re working with different data.”

Want to see what unit-level perception measurement looks like in practice?

Contact Us

Assessing Where Your Units Stand

Run through this self-check against the peer benchmarks above.

  • Can you produce unit-level safety perception scores for each behavioral health unit, or only a facility composite?
  • When was the last time a perception decline on a specific unit triggered a visible intervention your staff could see?
  • Do your charge nurses have explicit safety commitment language for shift handoff, or is communication left to individual discretion?
  • Can you verify actual response times on your highest-acuity unit with timestamped data from your CSO?
  • Do your nurses know what changed as a result of the last safety survey they completed?

If more than two answers point to the “most programs” column, that’s the gap. The CHRO measurement framework covers the corporate infrastructure needed to support what you build at the unit level.

One pattern worth flagging: facilities that run safety surveys without visibly acting on results see declining response rates and worsening scores [2]. Measurement without visible follow-through teaches staff that surveys are performative. The programs achieving leader-level results pair every measurement cycle with action staff can see.

See how one behavioral health provider documented these results across their facilities.

The charge nurse who says “it wasn’t that bad” during rounding isn’t describing the incident. She’s describing her expectation that reporting won’t change anything. The CNOs closing that gap are the ones retaining nurses others lose. Start with one unit, one validated pulse survey, and one 90-day measurement cycle. That’s how the peer CNO safety insights separating top programs from the 22.8% average begin.

PEER BENCHMARKS

See How Your Unit-Level Safety Data Compares

Leading behavioral health CNOs are using perception measurement to retain nurses others lose.

References

  1. PMC. Leadership Quality and Nurse Retention. https://pmc.ncbi.nlm.nih.gov/articles/PMC10806563/
  2. AHRQ PSNet. Culture of Safety. https://psnet.ahrq.gov/primer/culture-safety
  3. ROAR for Good. Internal data, 2024. Internal data

Nursing Safety Program: Unit-Level Perception Guide

nursing safety program CNO — hands annotating unit-level safety perception breakdown, circling low-scoring units on printed report

Key Takeaways

  • Unit-level perception data surfaces retention risk that facility-wide engagement scores and incident reports miss entirely
  • Charge nurse communication coaching is the highest-leverage intervention a CNO controls directly, with the shortest distance between action and perception shift
  • A focused 90-day measurement cycle on one high-turnover unit proves the model faster than a system-wide rollout

Your incident reports show nothing alarming. Your engagement survey scores look acceptable. Yet the resignations keep coming from your behavioral health units, and exit interviews keep circling back to safety.

The disconnect is a measurement problem. A nursing safety program built on incident counts and annual engagement composites can’t surface what’s actually driving departures: how safe your nurses believe they are, and whether they trust the organization to respond when something happens. This guide walks through how to measure safety perception at the unit level, coach the charge nurses who shape it daily, and coordinate the response systems that prove commitment. For the research behind why perception predicts retention, see the complete guide to staff safety in psychiatric hospitals.

What You Need Before You Start

Building a unit-level perception baseline takes about 90 days to establish and get a first quarterly comparison. You need your current engagement survey data (with safety-specific items identified), exit interview summaries, incident reports, and turnover data broken out by unit.

Your team: your CHRO or HR lead for survey infrastructure (the CHRO measurement framework covers the corporate side of this), your CSO for incident and response time data, and your directors of nursing for unit-level context.

If your exit interviews don’t currently include safety-specific questions, add two or three before moving forward: “Did safety concerns influence your decision to leave?” and “How would you rate our response to safety incidents?” The first round of responses tends to surface units no one flagged as high-risk.

Measuring Your Nursing Safety Program at the Unit Level

The critical shift here is moving from facility-wide scores to unit-level data. Your organization-wide average may look acceptable while specific units are in crisis. CNOs who have pulled safety-specific items from engagement surveys and scored them by unit often discover that their highest-turnover units share one trait: not the most incidents, but the lowest confidence that leadership will act on what gets reported.

Start with what you already have. Pull safety-related questions from your existing engagement survey and score them separately by unit. If your engagement instrument doesn’t include safety-specific items, add three to five targeted questions to your next pulse survey focused on organizational response, not just incident frequency.

Measurement StepOwnerDeliverableTimeline
Pull safety-specific items from engagement survey by unitClinical EducatorUnit-level scoresWeek 1-2
Add intent-to-stay questions to pulse surveyDirector of NursingQuarterly correlation dataWeek 2-4
Identify single highest-turnover behavioral health unitCNO (personal)Target unit for focused baselineWeek 1
Establish measurement frequency (quarterly minimum)CNO (personal)Measurement calendarWeek 2

Then add the question that connects perception to retention: “I would consider leaving this organization due to safety concerns.” That single item turns perception measurement into a workforce planning tool with documented outcomes. Cross-reference the results. Which units show the largest gap between low perception scores and high intent to leave? That’s where your retention risk concentrates.

If survey infrastructure doesn’t exist yet: Focus on your single highest-turnover unit first. Three to five safety-specific questions on a pulse survey takes under 10 minutes per nurse. One unit measured well proves the model faster than a facility-wide rollout.

Coaching Charge Nurses to Move Perception

Perception doesn’t shift because of policy memos or annual training refreshers. It shifts when staff experience visible, rapid organizational response to their safety concerns. And the person who shapes that daily experience on each unit is the charge nurse.

Leadership quality accounts for about 34% of the variation in whether nurses stay or leave [1]. One-third of your retention outcome depends on something you directly control: how your charge nurses communicate commitment to safety on every shift.

This means explicit coaching, not general encouragement. Your charge nurses need specific language for three moments:

  • Shift handoff: A sentence acknowledging current safety status and any open concerns from the prior shift. Not a policy reading. A direct statement: “We had an escalation on this unit yesterday, the response took under two minutes, and here’s what we’re doing differently today.”
  • After an incident: Visible follow-up that the reporting nurse can see. When a nurse reports an incident and nothing visibly happens, the lesson they learn is that reporting is pointless. Directors of nursing describe a pattern where a single failed response undoes months of goodwill.
  • During routine rounding: Asking one safety-specific question per round. Not “do you feel safe?” (too broad). Something like “is there anything about safety response on this unit you’d change?”

In behavioral health settings where this kind of visible communication was paired with documented safety systems, staff reporting they felt “very prepared” to respond to incidents went from 38% to 76% [2]. Peer CNOs using unit-level perception data describe charge nurse coaching as the intervention with the shortest distance between action and measurable perception shift.

Want to see what unit-level perception measurement looks like in practice?

Contact Us

Coordinating Response Systems With Your CSO

The other half of the perception equation is what happens when staff actually call for help. Charge nurses describe a telling detail: what registers with staff isn’t the difference between 30 seconds and three minutes on a stopwatch. It’s whether the person who called for help can still see the situation escalating when backup walks through the door. That visual, help arriving while the moment is still live, is what staff remember when asked whether the organization takes safety seriously.

Work with your CSO to verify actual response times on your target unit. Is there timestamped data, or are you relying on estimates? The nursing safety brief on unit-level perception data provides the specific talking points to bring into that conversation.

Coordination AreaCNO ResponsibilityCSO Responsibility
Response time verificationDefines acceptable threshold for clinical unitsProvides timestamped response data
Protocol reviewIdentifies unit-specific escalation patternsAdjusts protocols to match clinical workflow
Follow-up visibilityEnsures reporting nurses see documented outcomesDocuments and shares response records

Your 90-Day Unit-Level Action Plan

Start with your single highest-turnover behavioral health unit. Each percentage point of nursing turnover costs roughly $289,000 annually [3], so even one unit’s improvement builds the financial case for scaling.

  • Pull safety-specific engagement items and score them by unit this week. Can you identify your three lowest-scoring units without requesting new data?
  • Add two intent-to-stay questions to your next pulse survey cycle, distinguishing between “planning to leave the organization” and “planning to leave this unit”
  • Script three sentences of safety commitment language for charge nurses to use at shift handoff, and test the language with a charge nurse before rolling it out
  • Verify actual response times on your target unit with your CSO using timestamped data
  • Schedule a 90-day re-measure on your target unit with a comparison point, not just a single snapshot

See how one behavioral health provider documented these results across their facilities.

Your charge nurse on that high-acuity unit doesn’t need another policy update. She needs to see that when her team calls for help, help arrives fast, and that the organization measures whether she feels protected, not just whether an incident was filed. A nursing safety program that tracks perception at the unit level gives you the lead time to intervene before the next resignation letter lands on your desk. Start with one unit. Measure it well. The retention data will make the case for every unit after.

UNIT-LEVEL SAFETY

See Retention Risk at the Unit Level Before It Becomes a Vacancy

Behavioral health CNOs using perception measurement are catching turnover risk months before resignation letters arrive.

References

  1. PMC. Leadership Quality and Nurse Retention. https://pmc.ncbi.nlm.nih.gov/articles/PMC10806563/
  2. ROAR for Good. Internal data, 2024. Internal data
  3. NSI Nursing Solutions. 2025 NSI National Health Care Retention & RN Staffing Report. https://www.nsinursingsolutions.com/documents/library/nsi_national_health_care_retention_report.pdf

Peer CNO Safety Insights: Survey-Ready Evidence Systems

Peer CNO safety insights revealing incident reports disappearing through wall slot to nowhere

Key Takeaways

  • Peer CNOs who pass surveys confidently can show what happens after staff report an incident, not just that staff reported.
  • The shift from episodic preparation to continuous evidence generation is the common thread among nursing leaders whose teams demonstrate capability on demand.
  • Knowing where your investigation follow-through stands against peer benchmarks tells you exactly where to focus before your next survey.

Nearly half of nurses say workplace violence incidents are simply ignored after being reported. [1] Surveyors know this pattern. When they pull a random incident from your logs and ask to see the investigation trail, the answer reveals whether your program is actively managed or just actively documented. Peer CNO safety insights from facilities passing surveys confidently point to the same differentiator: it’s not whether your team reports incidents. It’s whether you can show what happened next.

How Peer CNOs Prepare Differently

Nursing leaders at survey-ready facilities have made a common shift. They’ve moved from preparing for surveys as a periodic event to building systems that generate evidence continuously. The difference shows up in how their teams handle the everyday moments that surveyors eventually ask about.

Investigation follow-through. When surveyors pull a random incident, peer CNOs can show the full trail: initial report, investigation notes, corrective actions, resolution, and communication back to the reporting staff member. Most facilities have the initial report. The trail goes cold after that.

“Most facilities have the initial report. The trail goes cold after that.”

Staff readiness across shifts. Surveyors interview nurses on nights and weekends deliberately. [3] Peer CNOs prepare all shifts equally by embedding safety discussions into shift huddles and post-incident debriefs, building current awareness rather than relying on annual training recall. [5]

Evidence speed. Survey-ready CNOs produce 90 days of incident data by unit within minutes. At-risk facilities spend hours compiling scattered records from multiple systems. When a surveyor is standing in your facility, that time gap defines the conversation.

Reporting culture. Only about a third of nurses say their employer gives them a clear way to report incidents. [1] Peer CNOs have addressed this by removing reporting barriers through automated capture. When reporting becomes effortless, the data starts reflecting reality rather than a fraction of it.

The Peer Benchmark

Where does your nursing program stand against peer CNOs preparing for the same surveys?

AreaSurvey-Ready ProgramsMost Programs
Investigation follow-throughEvery incident has documented findings and corrective actionsReports filed, investigation sporadic or missing
Evidence production90 days of data by unit in under 5 minutesHours of manual compilation from scattered systems
Staff interviewsNurses demonstrate protocols confidently across all shiftsDay shift strong, night shift vague
Response capabilityDocumented response times with historical trendingAnecdotal estimates
Reporting completenessAutomated capture reflecting actual incident volumeManual logs capturing a fraction of events

Facilities with documented safety systems show 93% of incidents resolved in under 2 minutes. [2] That benchmark matters because surveyors have seen it at other facilities. When your data shows longer times or doesn’t exist, the comparison works against you.

81% of workplace violence incidents go unreported. [4] Peer CNOs don’t treat this as an abstract problem. They treat it as a gap that automated capture can close, so their numbers actually reflect what’s happening on the units.

If you want to see where your investigation follow-through stands against peer benchmarks, we can walk you through it.

Contact Us

What Survey Confidence Looks Like for Nursing Leaders

Peer CNOs who describe survey experiences as confident rather than stressful share a pattern: their teams interact with safety systems daily, so describing protocols to a surveyor feels natural.

In facilities with documented safety systems, the share of staff who feel “very prepared” to respond to incidents nearly doubled after deployment. [2] Staff who’ve practiced response protocols show the kind of knowledge surveyors recognize immediately. Staff who attended annual training and haven’t touched the system since show vague recollection. The difference becomes obvious within 30 seconds of a surveyor conversation.

Facilities with documented safety technology have passed every Joint Commission and OSHA inspection in tracked deployments. [2] But the outcome peer CNOs emphasize isn’t the pass rate. It’s that their charge nurses can walk a surveyor through the response protocol, pull up response time data, and show investigation follow-through without needing to call anyone or check a binder.

See how one behavioral health provider documented these results across their facilities.

Your Readiness Self-Check

Before your next survey window, test yourself against peer benchmarks:

  • Investigation trail test. Pull 5 random incidents from the past 90 days. Does each have documented investigation findings, corrective actions, and communication back to the reporting staff?
  • Evidence speed test. Can you produce 90 days of incident data by unit within 5 minutes? If it takes a phone call to get started, that’s your answer.
  • Night shift readiness. Ask 3 nurses from different shifts to demonstrate the duress response protocol. Do their answers align?
  • Reporting reality check. Does your incident count reflect what your night shift nurses would describe in a confidential conversation, or does it look artificially low?
  • Post-incident process. When staff report an incident, do they know what happens next? If they believe reports disappear into a void, your reporting culture has a gap surveyors will find.

Start with the investigation trail test. Pull those 5 incidents. What you find will tell you exactly where your program stands relative to peer CNO safety insights, and where to focus before surveyors arrive.

PEER BENCHMARKS

See How Your Nursing Program Compares

Peer CNOs produce 90 days of incident data by unit in minutes. See what survey-ready evidence systems look like for nursing leadership.

References

  1. National Nurses United. Workplace Violence Report 2024. https://www.nationalnursesunited.org/sites/default/files/nnu/documents/0224_Workplace_Violence_Report.pdf
  2. ROAR for Good. Internal Data, 2024.
  3. Joint Commission. Workplace Violence Prevention Program. https://www.jointcommission.org/en-us/knowledge-library/workforce-safety-and-well-being-resource-center/workplace-violence-prevention/workplace-violence-prevention-program
  4. Agency for Healthcare Research and Quality (AHRQ) PSNet. Addressing Workplace Violence and Creating a Safer Workplace. 2023. https://psnet.ahrq.gov/perspective/addressing-workplace-violence-and-creating-safer-workplace
  5. Vizient. Workplace Violence Prevention: Supporting Inpatient Behavioral Health Bedside Staff. https://www.vizientinc.com/insights/blogs/2024/workplace-violence-prevention-supporting-inpatient-behavioral-health-bedside-staff