Key Takeaways
- Leading behavioral health HR teams connect nurse duress data to retention dashboards, workers’ comp reviews, and union talks rather than leaving it in security’s system.
- Most behavioral health organizations have safety systems producing data that HR never uses for workforce decisions, and the gap between leaders and the field is growing each quarter.
- The pattern keeping most HR teams behind: treating deployment as a finished purchase rather than the start of ongoing workforce data connection.
Leading behavioral health CHROs have stopped treating nurse duress as a security purchase. They’ve moved safety data onto retention dashboards, into workers’ comp reviews, and onto the table during union talks. The real peer CHRO safety insights question is whether HR owns the data your system produces. This guide maps where peer HR teams actually stand across three workforce dimensions so you can find your spot on the curve.
How Peer CHROs Frame Nurse Duress: Safety Insights for Workforce Strategy
A growing group of CHROs now treats nurse duress as a workforce strategy tool, not a line item in security’s budget. The reason: 60% of nurses have changed jobs, left, or considered leaving because of workplace violence [1].
When the majority of your nursing workforce factors violence into whether they stay, the problem belongs to whoever owns retention. That’s you. The CHROs pulling ahead claimed that data stream and connected it to the workforce decisions they make each quarter.
Three Workforce Dimensions That Matter
Peer CHROs who lead on safety focus on three specific dimensions. Each one connects safety technology to an HR-owned metric.
| Dimension | What Leaders Do | What It Produces |
|---|---|---|
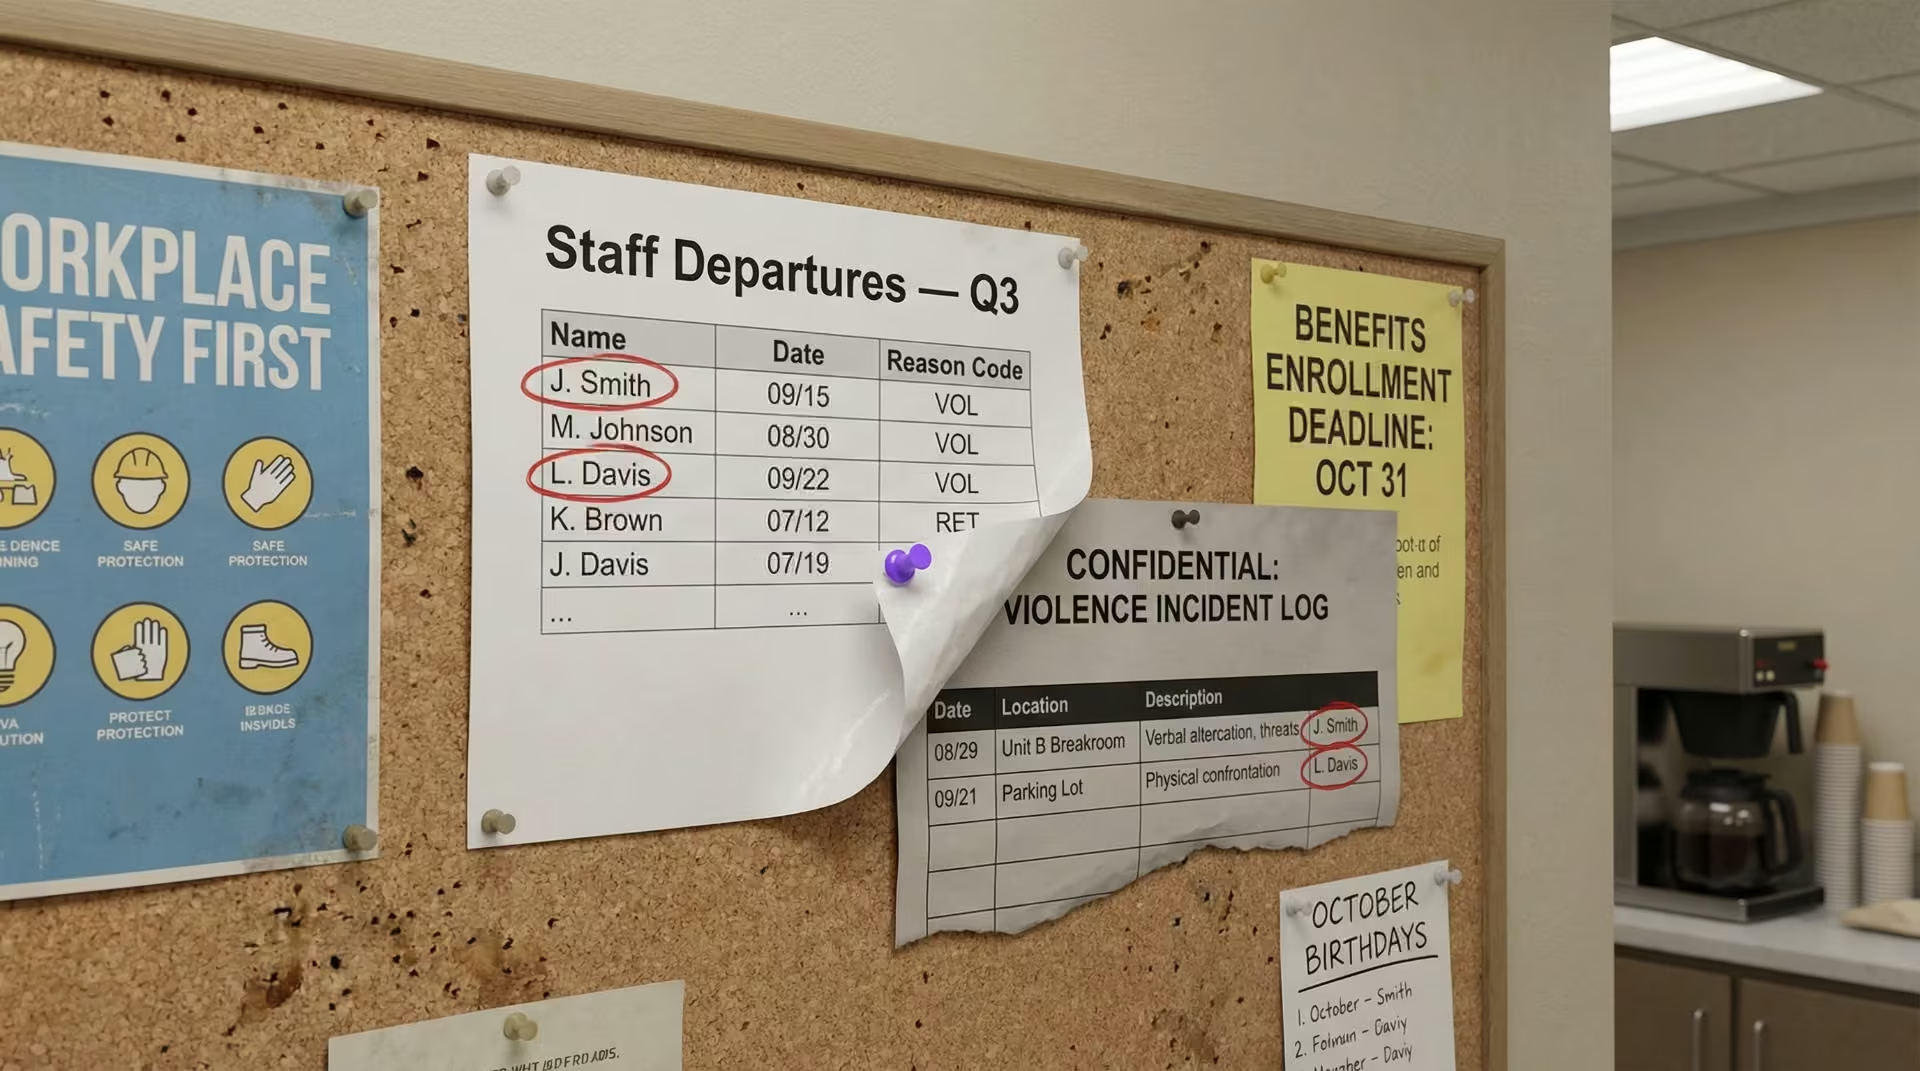
| 1. Retention Dashboards | Connect safety incident data to turnover dashboards and exit interview themes | Visibility into which departures are violence-driven and which units need help |
| 2. Workers’ Comp Management | Cross-reference duress response times with injury claims each quarter | A cost-reduction pattern that gives HR leverage in CFO budget talks |
| 3. Labor Relations | Reference safety technology outcomes during union talks and contract negotiations | Evidence that shifts grievance discussions toward partnership |
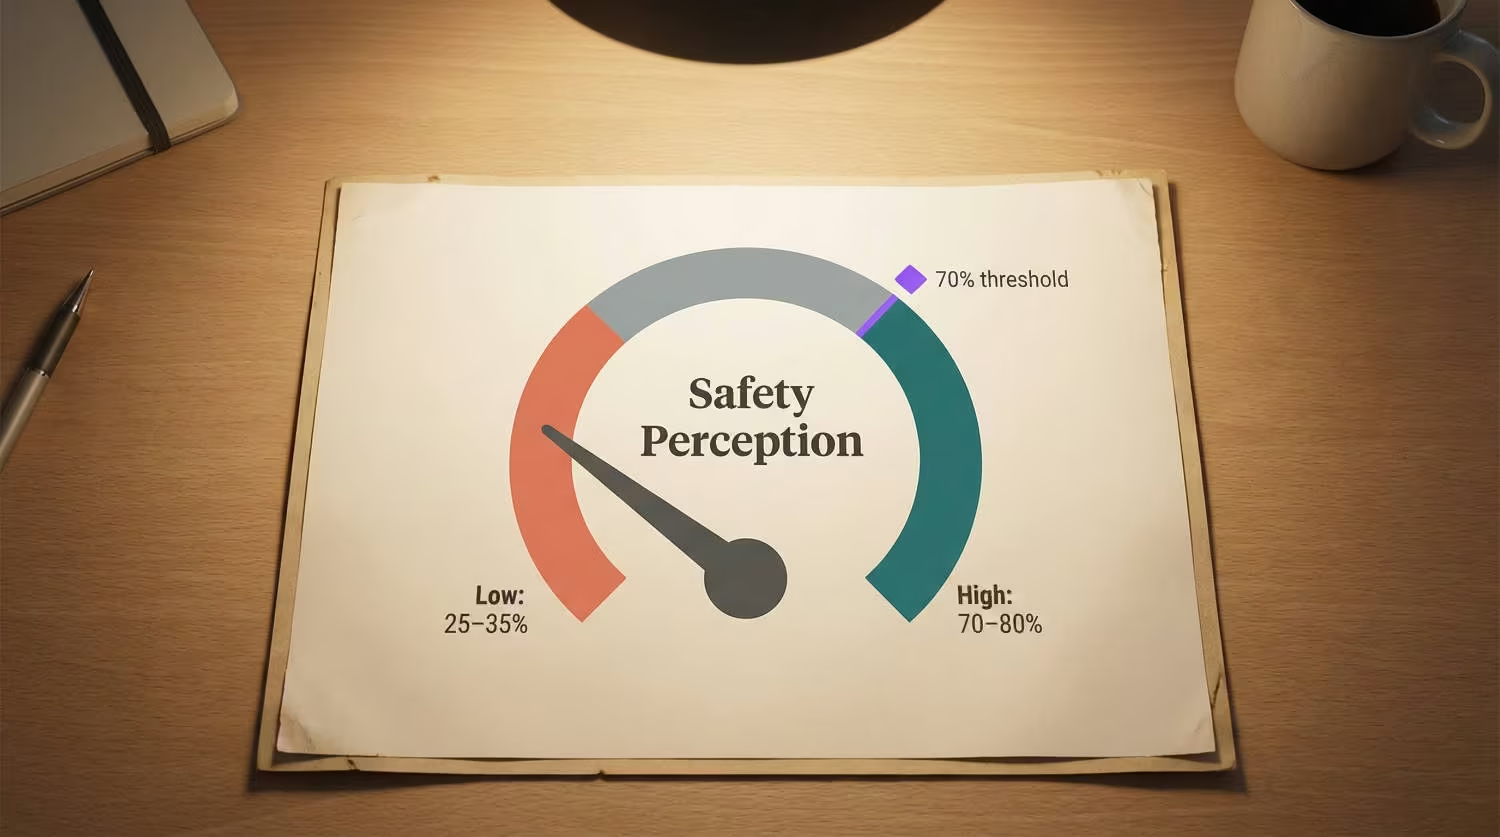
On retention, organizations where HR connected safety data saw intent-to-leave over safety concerns drop from 22% to 7% [2]. That’s the kind of shift that shows up in your next engagement survey.
On workers’ comp, peer organizations report 24% to 50% reductions in claims after connection [2]. Each trauma-related workers’ comp claim averages $68,231 [3]. When HR connects response data to claims reviews, the pattern between faster response and fewer claims becomes visible.
Between 2022 and 2024, 43% of newly negotiated RN contracts in behavioral health included workplace violence prevention language [4]. CHROs who bring deployment outcome data to the table shift the conversation from grievance to shared progress.
See how one behavioral health provider documented these results across their facilities.
Where Most HR Teams Actually Stand
Survey data suggests the field breaks into four groups.
| Integration Level | What It Looks Like | Estimated Share |
|---|---|---|
| Leaders | Safety data connected to retention dashboards, workers’ comp, and labor relations | A small share of behavioral health organizations |
| Advancing | Connected on 1-2 dimensions, piloting on others | A growing share |
| Tracking | Incidents tracked centrally, but HR doesn’t use the data for workforce decisions | Roughly half of behavioral health organizations |
| Not Started | Safety remains entirely a security or facilities function | A significant share of hospital CHROs report this |
Most organizations land in “Tracking.” That’s common, and it’s where most of your peers are too. It means the data exists but hasn’t been connected to the workforce systems you already run.
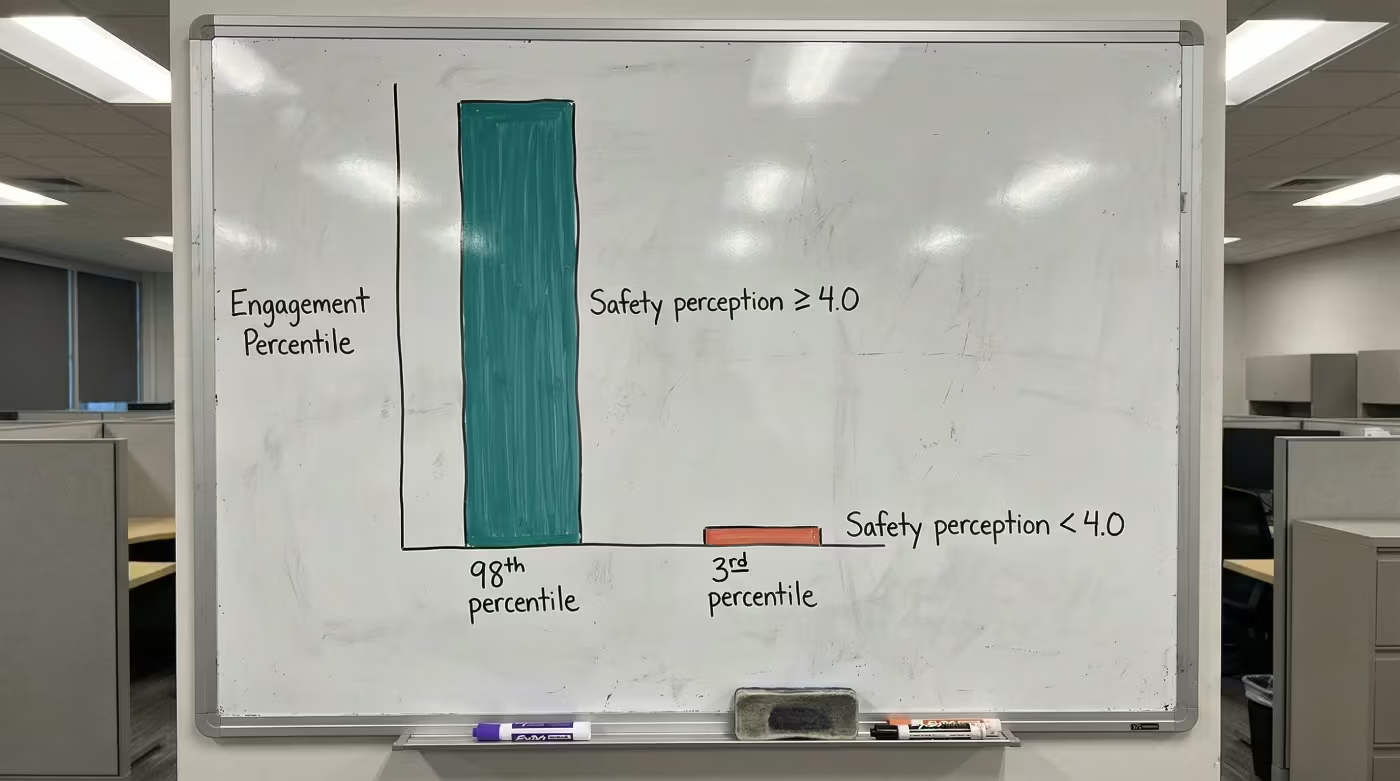
What separates the leaders? Organizations at the top tier report staff satisfaction climbing measurably within a single quarter after connection [2]. Meanwhile, 59% of hospitals have a formal retention strategy, but few connect those strategies to safety data [5]. The retention program and the safety program run on parallel tracks. Leaders merged them.
Want to see how your HR team's integration compares to peer organizations? A behavioral health safety specialist can walk through the dimensions with you.
Contact UsThe Pattern Keeping HR Teams Behind
The sticking point is how organizations categorize the purchase after deployment. When safety technology gets treated as a completed project, the data it produces stays in security’s system. HR sees a summary report at best. The incident details, response times, and resolution metrics that would change workforce decisions never reach your dashboards.
This matters more than most CHROs realize. 81% of workplace violence incidents go unreported [6]. The data security captures is already incomplete. Without HR connection, the picture gets even thinner. You can’t build a retention strategy around data you can’t see.
Three structural barriers keep most HR teams from claiming safety data:
- Separate budget ownership between security and HR
- Misaligned metrics between departments
- Organizational habit of treating safety as someone else’s job
Each barrier is solvable. Solving them requires HR to claim the data directly.
Matching Your Peer CHRO Safety Insights to Action
Peer CHROs who moved to the leader tier followed a consistent sequence. Most started by forming an HR-security joint steering committee. That single step created shared ownership of the data.
From there, the path depends on where you stand today:
- Not Started: Form an HR-security steering committee to establish shared data access
- Tracking: Launch a shared dashboard pilot connecting safety data to your biggest gap dimension
- Advancing: Link safety data to retention forecasting and include it in your next board report
Organizations that completed the full connection pathway report combined improvements: faster emergency response and measurable decreases in workers’ comp claims within the same period [2]. These results come from organizations that completed the full connection pathway; the outcomes reflect what’s possible when HR claims the data, rather than a guarantee for every deployment context.
You can assess your position in a single meeting. Check three things:
- Does safety incident data flow into your HR retention dashboards?
- Do your workers’ comp reviews include duress response metrics?
- Did your most recent union conversation reference your safety technology investment?
Peer CHROs who lead on these dimensions started with the same check. The difference is they claimed the data before someone else defined what it meant. Start with whichever question you answered “no” to first. That’s how most leading organizations began, and it’s where peer CHRO safety insights turn into action. An HR safety brief built for budget approval gives you the format to turn these dimensions into a funded ask.
PEER INSIGHTS
See How Your Integration Compares to Peers
Leading HR teams already connect safety data to retention, workers' comp, and labor relations. A behavioral health safety specialist can show you what the path from tracking to full connection looks like for your organization.
References
- National Nurses United. 2024 Workplace Violence Report. https://www.nationalnursesunited.org/sites/default/files/nnu/documents/0224_Workplace_Violence_Report.pdf
- ROAR for Good. Internal Deployment Data, 2024.
- National Safety Council. Workers’ Compensation Costs. https://injuryfacts.nsc.org/work/costs/workers-compensation-costs/
- National Nurses United. 2024 Workplace Violence Report (contract analysis). https://www.nationalnursesunited.org/sites/default/files/nnu/documents/0224_Workplace_Violence_Report.pdf
- NSI Nursing Solutions. 2025 National Health Care Retention & RN Staffing Report. https://www.nsinursingsolutions.com/documents/library/nsi_national_health_care_retention_report.pdf
- AHRQ PSNet. Addressing Workplace Violence and Creating a Safer Workplace. https://psnet.ahrq.gov/perspective/addressing-workplace-violence-and-creating-safer-workplace