Staff Safety in Psychiatric Hospitals Data: Retention
Key Takeaways
- This evidence brief compiles the peer-reviewed and recorded data connecting safety perception to retention, financial outcomes, and workforce stability in behavioral health
- The evidence summary table consolidates every data point a CFO needs to evaluate safety perception as a retention lever
- A verification checklist at the end shows whether your facility has the measurement infrastructure to build the business case
Exit interviews keep surfacing safety concerns. Your turnover dashboard keeps climbing. This staff safety in psychiatric hospitals data brief connects those two signals with the specific evidence your CFO needs: peer-reviewed correlation data, recorded before-and-after outcomes, and a financial translation that turns perception improvement into dollar savings. For the full framework behind why perception predicts retention, see the complete guide to staff safety in psychiatric hospitals.
The Perception-Retention Correlation
Safety culture predicts turnover intent with a strong negative correlation. Peer-reviewed research recorded a correlation of -0.883 between safety culture perception and nursing turnover intention [1]. Safety culture accounted for about 6.4% of turnover intent independently [1], which is notable given that it competes with compensation, scheduling, management quality, and commute time for the same outcome.
60% of nurses have changed or left their job due to workplace violence [2]. In behavioral health, where turnover exceeds the national nursing average by more than 6 percentage points [3], each departure costs more than the sector average because the replacement pool is smaller.
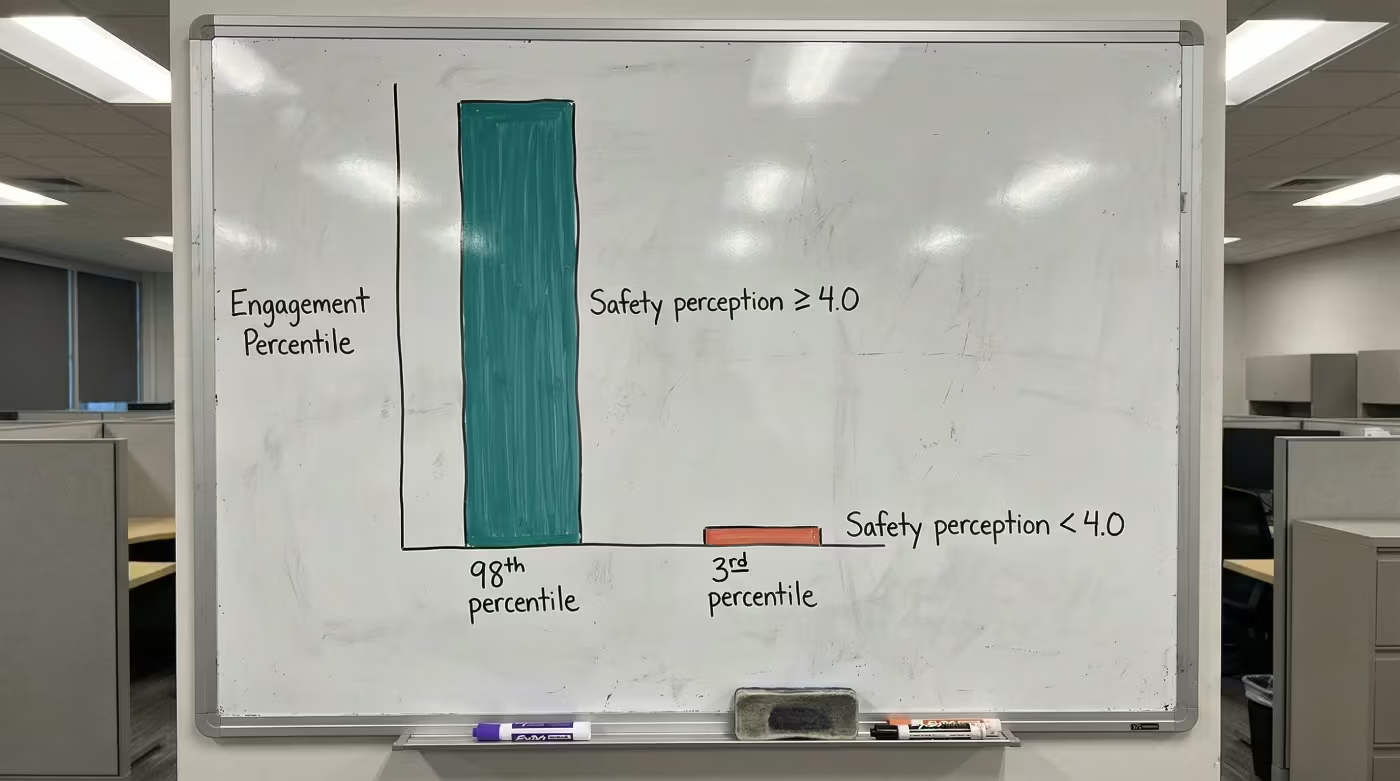
The engagement connection reinforces this. When safety perception scores reach 4.0 or above on a 5-point scale, engagement ranks at the highest levels nationally. When scores drop below that threshold, engagement collapses [4]. Safety perception drives engagement, and engagement drives retention. That chain is now documented at every link. The CHRO measurement framework covers how to surface this connection in your own data.
Recorded Before-and-After Outcomes
Facilities that established baselines, intervened, and re-measured recorded the following shifts [5]:
| Metric | Before | After | Change |
|---|---|---|---|
| Intent-to-leave due to safety concerns | 22% | 7% | 15-point reduction |
| "I feel safe at work" sentiment | Baseline | Up to 38-point lift | Maximum recorded increase |
| Staff satisfaction with safety | 57% | 73% | 16-point gain in 3 months |
| Staff feeling "very prepared" for incidents | 38% | 76% | 38-point increase |
| Team members reporting increased confidence | — | ~80% | — |
The 38-point lift represents the maximum recorded increase. Facilities with higher starting baselines should expect smaller gains over longer timelines. The 57% to 73% satisfaction shift happened within a single quarter, placing it at the fastest end of recorded timelines.
What these numbers share: every one was captured through before-and-after measurement. That measurement discipline is the step most facilities skip, and it's the step that turns a wellness initiative into a workforce planning tool with documented outcomes.
Ready to build the evidence portfolio for your next budget conversation?
Contact UsThe Financial Case
| Category | Metric | Value |
|---|---|---|
| Cost of turnover | Per-RN replacement cost | $61,110-$88,000 [3] |
| Cost of turnover | Per-percentage-point turnover cost | $289,000/year [3] |
| Cost of turnover | BH setting (200 nurses, 22% turnover) | ~$6.4M annually |
| Value of intervention | Intent-to-leave reduction | 15 percentage points [5] |
| Value of intervention | Workers' comp claims reduction | 24-50% [5] |
| Value of intervention | Timeline to measurable change | 3-9 months [6] |
For a behavioral health facility running 18% turnover, dropping to 15% represents roughly $867,000 in annual savings. The workers' comp reductions (24-50%) depend on baseline severity; the higher end came from facilities with the most severe incident rates. The full comparison across organizational models shows how these numbers scale by facility size.
See how one behavioral health provider documented these results across their facilities.
The Evidence Summary
The evidence chain below consolidates what a CFO needs to evaluate safety perception as a retention lever.
| Claim | Evidence | Source |
|---|---|---|
| Safety perception predicts turnover | Correlation of -0.883 (p = .006) | Peer-reviewed [1] |
| Perception drives engagement | Dramatic gap between high and low perception scores on engagement | Press Ganey / AHRQ [4] |
| Perception improvement is measurable | Up to 38-point sentiment increase | Recorded deployments [5] |
| Perception change reduces intent-to-leave | 22% to 7% | Recorded deployments [5] |
| Each turnover point has financial value | $289,000/year | NSI 2025 Report [3] |
| BH is the highest-ROI setting | Highest turnover + highest violence rates in healthcare | NSI [3], Sheps Center [7] |
Behavioral health's combination of high turnover and high violence rates makes it the setting where safety perception improvement yields the greatest per-dollar retention return. Even a fraction of the documented shifts, in a setting where each turnover point costs $289,000, changes the math. Peer CHROs building this data into their workforce dashboards describe it as the business case that finally moved the budget conversation.
Evidence Portfolio Checklist
Before your next budget conversation, verify whether you can produce answers to these:
| Verification Question | Why It Matters |
|---|---|
| Can you produce a dated baseline for "I feel safe at work" scores across behavioral health units? | Without a baseline, no improvement is provable |
| Do exit interviews specifically ask about safety perception (not just "workplace concerns")? | Vague questions produce vague data |
| Are you tracking incidents filed versus incidents witnessed? | Reported data alone understates the problem (81% unreported [4]) |
| Does workers' comp data connect to specific units and shifts? | Facility-level totals hide the highest-risk areas |
| Can you show a 3-month and 9-month trendline on safety perception scores? | Trendlines prove sustained change, not one-time bumps |
The HR brief on safety perception metrics provides the specific data points to bring into each of these verification areas.
The staff safety in psychiatric hospitals data is clear: perception predicts turnover intent, perception improvement produces recorded retention shifts, and each turnover point saved returns $289,000 annually. The evidence exists to transform exit interview patterns into a quantified business case.
EVIDENCE PORTFOLIO
Build the Business Case Your CFO Needs
The peer-reviewed and recorded data connecting safety perception to retention exists. See what it looks like for your facility.
References
- PMC. Patient Safety Culture, Resilience, and Turnover Intention Among Nurses. https://pmc.ncbi.nlm.nih.gov/articles/PMC12896111/
- National Nurses United. Workplace Violence Report. https://www.nationalnursesunited.org/press/nnu-report-shows-increased-rates-of-workplace-violence-experienced-by-nurses
- NSI Nursing Solutions. 2025 National Health Care Retention & RN Staffing Report. https://www.nsinursingsolutions.com/documents/library/nsi_national_health_care_retention_report.pdf
- AHRQ PSNet. Ensuring Patient and Workforce Safety. https://psnet.ahrq.gov/perspective/ensuring-patient-and-workforce-safety-culture-healthcare
- ROAR for Good. Internal data, 2024. Internal data
- Dove Press. Workplace Violence Prevention in Healthcare. https://www.dovepress.com/article/download/80739
- Sheps Center. Trends in Workplace Violence, 2025. https://www.shepscenter.unc.edu/wp-content/uploads/2025/01/Y10.01_Brief-1.pdf


