Key Takeaways
- The locations where workplace violence happens most often in behavioral health facilities are the same locations where WiFi-dependent safety systems lose signal, and you can find that overlap with data you already have.
- A structured walkthrough process using incident reports and coverage maps shows you where bluetooth panic button safety gaps are and builds the evidence case for closing them.
- Deploying coverage in highest-risk zones first, then expanding facility-wide, gives security leaders a defensible, documented safety program that holds up under survey scrutiny.
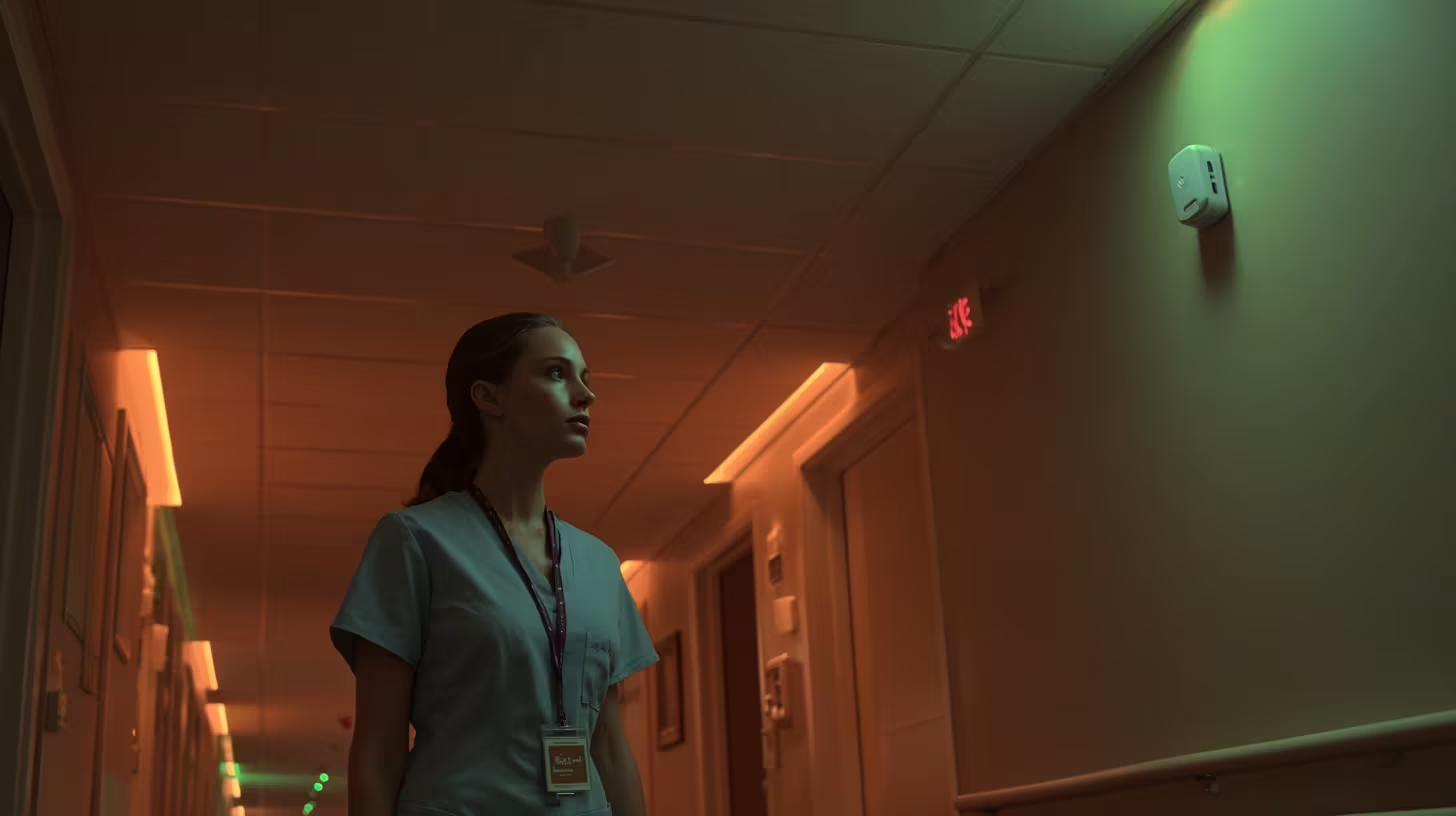
Your monthly incident reports keep telling the same story. The stairwell between units. The parking lot after second shift. The outdoor courtyard during patient transport. These locations show up month after month because they are where your WiFi-dependent bluetooth panic button safety system goes silent.
Reinforced concrete and metal fire doors block WiFi signals. The same construction materials that keep patients contained are the ones that create dead zones for staff. The coverage map and the incident map overlap in exactly the wrong places.
This guide walks through how to find those gaps, document them, and close them with technology that works where WiFi can’t.
Start With What You Already Have: Incident Data and Coverage Maps
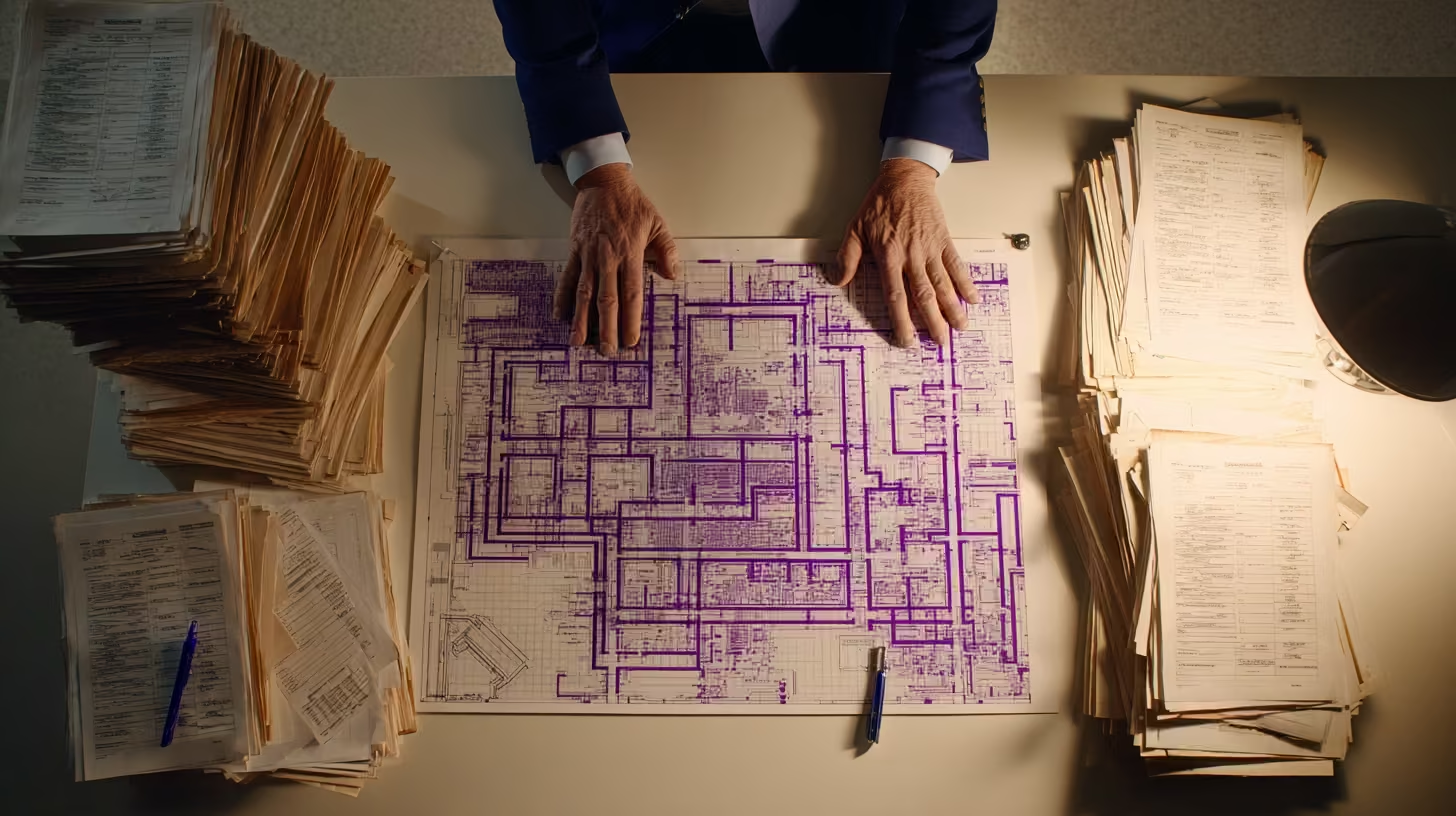
Before evaluating any new technology, build the case with data that already sits in your systems.
Pull your last 12 months of incident location data. Your violence prevention committee, your CNO, or your risk management team should have this. Then get current WiFi coverage maps from your technology staff. Overlay the two datasets. Across behavioral health facilities, the pattern is consistent: the areas where incidents cluster are the areas where coverage drops.
What you are looking for:
- Which incident locations fall inside documented WiFi dead zones
- Whether the same locations appear repeatedly across months
- Which high-traffic staff areas (parking lots, stairwells, outdoor walkways) have no coverage at all
- Whether your coverage maps were tested with doors in their normal locked position or standing open
That last point matters more than most people realize. WiFi signal tests run with doors propped open produce coverage maps that look nothing like what your facility actually looks like day to day. Reinforced doors in locked position block enough signal to turn a covered corridor into a dead zone.
For multi-site teams, this assessment must happen at each facility separately. Construction materials and layouts vary building to building, and a coverage map from one location tells you nothing about another.
The Locations That Matter Most
Focus your coverage checks on the locations you worry about most, not the locations easiest to cover.
| Location | Why It Matters | What to Test |
|---|---|---|
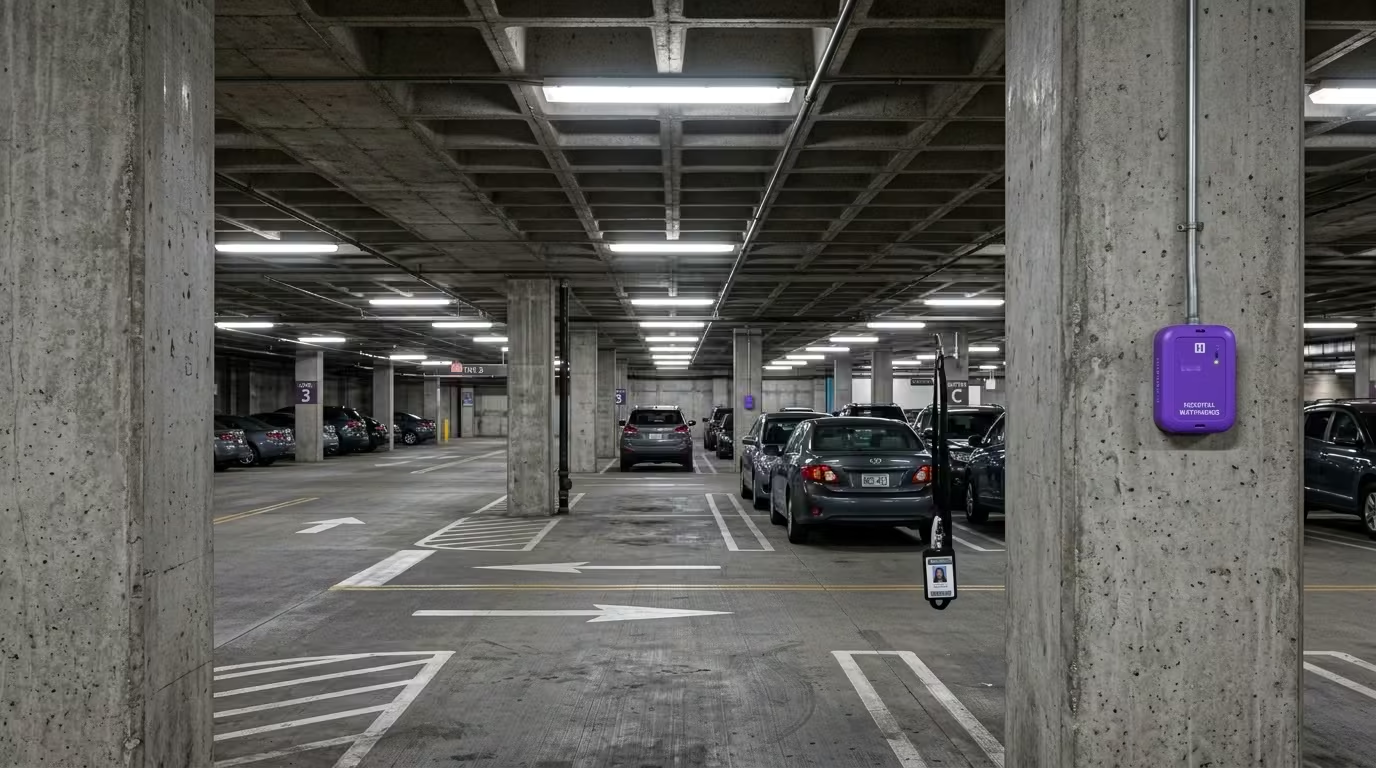
| Parking lots and structures | Where a large share of healthcare violence happens [1] | Test at facility perimeter and every level of parking structures |
| Stairwells | Among the highest-risk areas for staff injury [2] | Test with fire doors in closed and locked position |
| Outdoor transition areas | Nothing covers the open space between buildings | Test at maximum distance between buildings |
| Elevator cabs | Metal enclosure blocks most wireless signals [2] | Test at each floor with doors closed |
| Older building wings | Thick walls and old construction block signals even more | Test in corridors and patient rooms, not just common areas |
Walk these locations yourself with a test device. Press the panic button in the parking garage on level three. Press it in the stairwell with the fire door shut. Press it in the outdoor walkway between buildings at the farthest point from either entrance.
If the alert doesn’t go through, your staff already know. They figured out which zones are dead long before any formal audit confirmed it.
See how one behavioral health provider documented coverage results across their facilities.
What Closes the Gap
The dead zone problem is structural. WiFi can’t reach these areas because the building materials physically block the signal. Extending WiFi or running wires into a parking garage or a concrete stairwell is expensive, disruptive, and often still unreliable.
Standalone wireless safety systems operate on their own network, independent of facility WiFi [3]. Battery-powered beacons require no wiring, run for years on standard batteries, and go in areas that wired systems could never reach. If one beacon goes down, the network routes around it automatically.
What that means for your walkthrough: the parking structure, the stairwell, and the outdoor courtyard all become covered zones. During a four-hour power outage at one facility, the safety system kept running on battery power with six to eight hours of backup while WiFi went dark [4].
For the full technical breakdown of how this architecture works, the CTO evaluation guide covers it in detail.
If your walkthrough confirmed dead zones in high-risk areas, we can help you map a deployment plan.
Contact UsBluetooth Panic Button Safety: Who Owns What
Bluetooth panic button safety deployment works when responsibilities are clear from the start.
| Task | Corporate Security | Facility Security Director | CSO Role |
|---|---|---|---|
| Coverage standards | Establish enterprise-wide requirements | Execute within corporate standards | Define what “complete coverage” means for each site |
| Gap assessment | Provide assessment framework | Conduct site-specific walkthrough | Review results against incident data |
| Deployment oversight | Monitor enterprise rollout | Execute facility deployment | Verify coverage in previously uncovered zones |
| Compliance records | Establish documentation standards | Maintain site-specific evidence | Ensure evidence package is survey-ready |
Joint Commission workplace violence prevention standards took effect in July 2024 for behavioral health settings [5], and surveyors have started asking for coverage proof in parking structures and outdoor areas. Loss of accreditation puts Medicare and Medicaid funding at risk [6]. The technology alone doesn’t protect you in a survey. The evidence package does.
Get your current incident numbers on record before deployment. You need a documented before-and-after comparison. Without it, proving program effectiveness to leadership and surveyors becomes a credibility problem.
Your Assessment Checklist for This Week
You don’t need to wait for budget approval or a vendor selection to start. The assessment itself is free and builds the case for everything that follows.
- Pull 12 months of incident location data and overlay it against current WiFi coverage maps. Where do the clusters land relative to your dead zones?
- Walk your parking structures, stairwells, and outdoor transition areas with a test device. Can you trigger and receive an alert from every location where staff actually work?
- Confirm with facilities management whether WiFi access points sit on backup generator circuits. If they don’t, document the gap.
- Verify you can pull up audit logs within 30 minutes of a surveyor request. Surveyors don’t schedule these asks in advance.
- Ask your violence prevention committee: can staff name the zones where they don’t trust the system? That list is your real coverage audit.
Start with the parking lot that showed up on last month’s incident report. With the assessment complete and gaps documented, bluetooth panic button safety coverage can extend to every location where incidents actually happen. One zone at a time is how coverage gaps close for good.
STAFF SAFETY
Close the Dead Zones in Your Facility
Bluetooth panic button safety coverage that reaches every parking lot, stairwell, and outdoor area where your staff work.
References
- ASPR TRACIE / American Hospital Association. https://files.asprtracie.hhs.gov/documents/on-campus-hospital-armed-assailant-planning-considerations.pdf
- Office of Justice Programs. https://www.ojp.gov/pdffiles/cptedpkg.pdf
- NCBI. https://pmc.ncbi.nlm.nih.gov/articles/PMC11435828/
- ROAR for Good – Internal Data, 2024.
- Joint Commission. https://www.jointcommission.org/en-us/knowledge-library/workforce-safety-and-well-being-resource-center/workplace-violence-prevention/workplace-violence-prevention-program
- Facilio. https://facilio.ae/blog/healthcare-joint-commission-compliance/