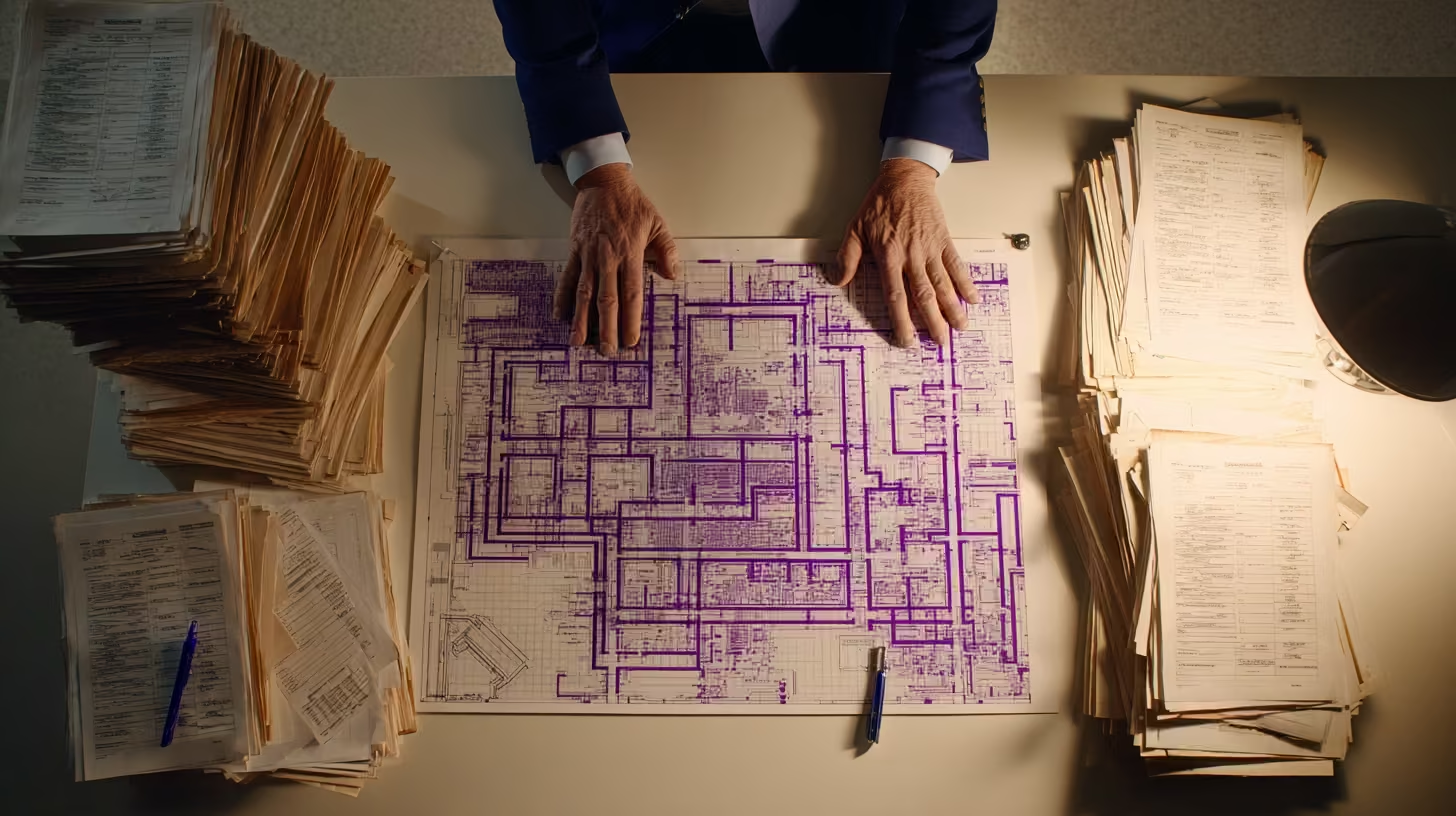
Security leaders who can map their facility’s coverage gaps carry the weight of knowing exactly where staff are unprotected, and every incident in a flagged location deepens that burden.
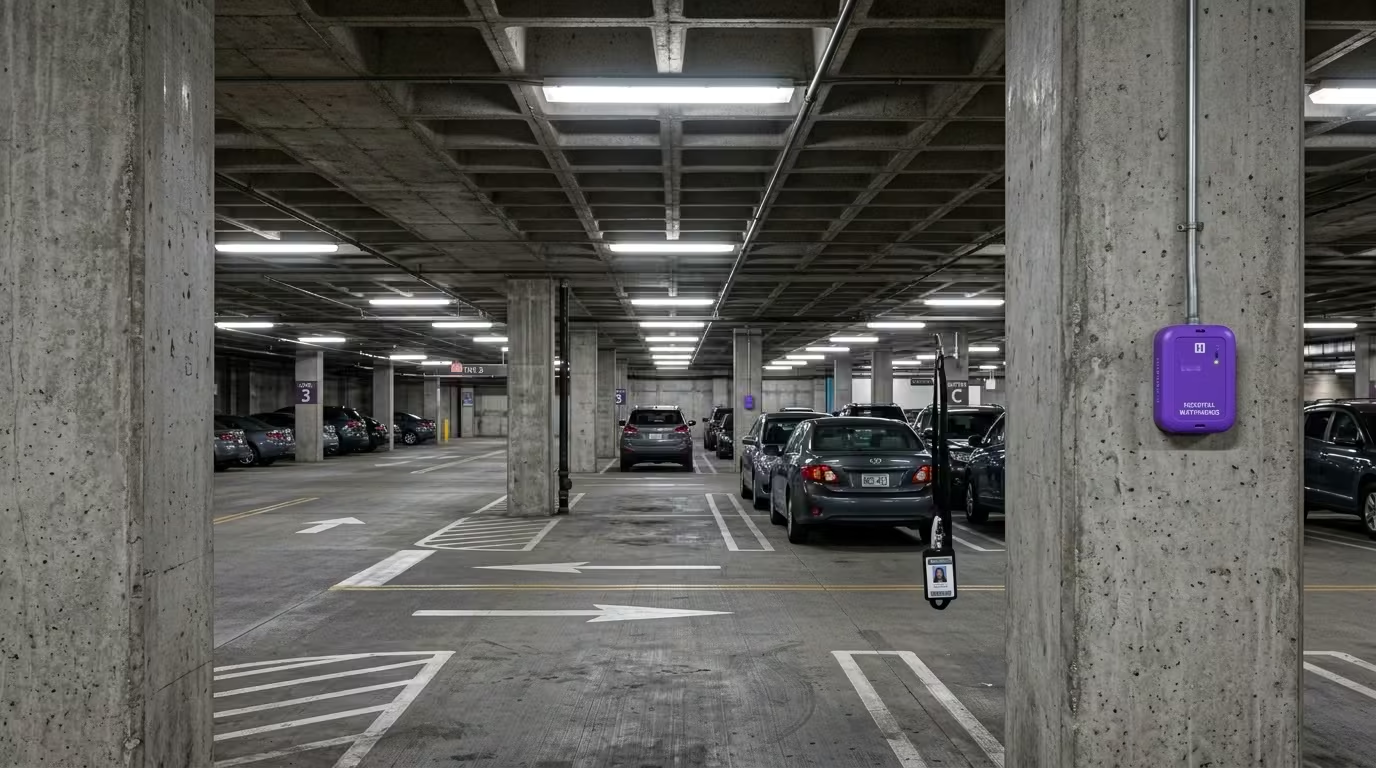
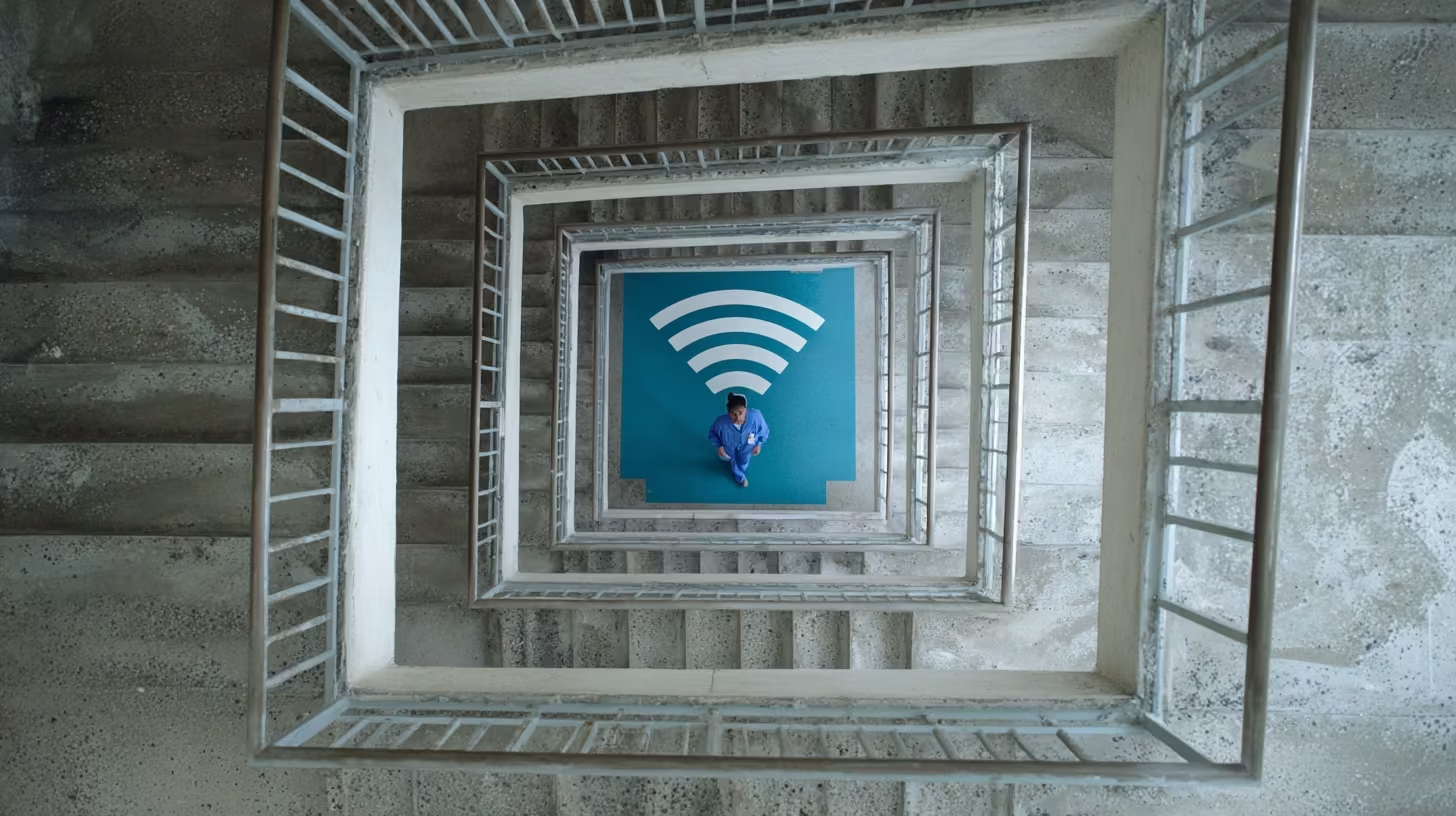
Bluetooth panic button confidence requires protection that works in parking lots, stairwells, and outdoor areas independent of facility WiFi, because those are the zones where violence concentrates.
When verified coverage reaches every zone, staff trust in the safety program shifts measurably and the anxiety of managing around known blind spots lifts.
The locations that show up most often on incident reports are the same locations where WiFi-dependent safety systems lose signal. Parking lots. Stairwells. Outdoor transition areas between buildings. Security directors know this because they have walked those zones, flagged them, and watched the same locations appear in reports quarter after quarter.
That overlap is what makes bluetooth panic button confidence feel out of reach. You can see exactly where the gaps are. You know incidents will keep happening there. And with a WiFi-dependent system, you have no way to close them.
Where Incidents Concentrate and Coverage Disappears
Parking lots account for roughly one in four to two in five healthcare workplace violence incidents [1]. Stairwells and outdoor transition zones follow close behind. Psychiatric and substance abuse hospitals record more than 110 violent incidents for every 10,000 workers [2], and the worst of it happens in areas with the weakest coverage.
Security leaders describe the same pattern when they overlay incident data onto coverage maps. The clusters sit directly on top of the dead zones. The areas flagged for safety concerns are the same areas where the safety system goes quiet.
For CSOs, this creates a specific kind of burden. You can see the risk. You have documented it. And the current system can’t reach it.
What Your Staff Already Know
Staff figure out coverage gaps faster than any formal audit. More than eight in ten psychiatric nurses faced workplace violence in the past year, and more than half experienced physical attacks [3]. Yet roughly the same proportion of healthcare workers who experience violence never fully report it [4].
The connection between those two numbers runs through your dead zones. When staff learn which areas are covered and which aren’t, behavior shifts:
Devices stop getting carried in zones where signals drop
Incidents in dead zones go unreported because no one will respond anyway
New hires learn from colleagues which hallways and parking levels to avoid after dark
Violence prevention committees hear the same question repeatedly: “What’s the point if it doesn’t reach the parking lot?”
That informal knowledge is your real coverage audit. And it tells a different story than the vendor’s coverage map.
The Joint Commission issued workplace violence prevention standards effective July 2024 for behavioral health settings [5], and state-level panic button mandates need devices to work reliably across entire facilities [6]. Assessors have started asking for coverage proof in parking structures and outdoor areas. The dead zones that staff already know about are becoming the dead zones that surveyors will document.
When Bluetooth Panic Button Confidence Becomes Real
The shift happens when the safety system stops depending on WiFi. Standalone wireless safety networks operate on their own infrastructure, separate from facility WiFi, separate from the hospital network [7]. They reach the zones that WiFi can’t: parking lots, stairwells, outdoor walkways, older building sections with dense construction.
What that means in practice: protection that reaches the parking structure on level P3. The stairwell between locked units. The outdoor courtyard where staff take breaks. Every location that appeared on incident reports and disappeared from coverage maps.
During a four-hour power outage at one facility, the safety system kept running on battery power with six to eight hours of backup [8]. WiFi went down. Lighting went down. The safety network stayed live in every zone because it never depended on the infrastructure that failed.
For a security leader who has spent years managing around known blind spots, that shift changes what the role feels like day to day.
If your facility has coverage gaps you already know about, we can help you map them and fix them.
When verified coverage reaches every area of the facility, things change for security leaders and for frontline staff.
What CSOs carry with coverage gaps
What changes with verified full coverage
Knowing which zones are unprotected and waiting for the next incident there
Every zone documented and covered, including the locations that previously had no protection
Staff distrust visible in underreporting and devices left behind
Staff confidence measurable in reporting rates and how often devices are actually carried
Survey anxiety about coverage questions with no good answer
Coverage proof for every room and area an assessor might ask about
Incident reports that confirm the same dead zones quarter after quarter
The pattern breaks because the dead zones no longer exist
Behavioral health facilities report up to a 38-point jump in staff responses to “I feel safe at work” after deploying coverage that reaches every zone [8]. Results vary by facility size and how visibly the deployment was communicated, but the direction is consistent: when staff believe the system works everywhere, their relationship with the safety program changes.
What shifts for CSOs:
The gap between what you know and what you can fix closes
Your incident reports stop pointing to the same blind spots
Coverage becomes something you can show a surveyor, not something you explain around
The weight of knowing where people are unprotected lifts
Bluetooth panic button confidence is specific. It means verified protection in every parking lot, stairwell, and outdoor area where your staff work and where incidents happen. The dead zones on this morning’s incident report can be the last ones your facility carries.
STAFF SAFETY
Coverage That Reaches Every Zone in Your Facility
Bluetooth panic button confidence starts with verified protection in every parking lot, stairwell, and outdoor area where your staff work.
Security directors at peer behavioral health facilities stopped trying to extend WiFi into dead zones and shifted to safety systems that don’t depend on facility networks at all.
The peer conversation changed after high-profile infrastructure failures proved that WiFi-dependent duress systems fail at the exact moment facilities are most chaotic.
Facilities that made the switch are reporting consistent coverage in every zone, resilience during outages, and a measurable edge in staff recruitment and retention.
Peer CSO safety insights from behavioral health facilities with the same infrastructure challenges keep pointing to one conclusion: the problem security directors solved wasn’t WiFi quality. It was WiFi dependency.
The security leaders who moved first didn’t wait for a perfect network. They stopped asking their technology staff to fix coverage in parking garages and stairwells, and started evaluating systems that bypass facility WiFi entirely.
The Day the Infrastructure Question Got Answered
On July 19, 2024, a defective software update crashed millions of Windows systems worldwide, disrupting healthcare delivery across at least a dozen major U.S. hospital systems [1]. Electronic health records went down. Monitoring platforms went dark. Staff across multiple facilities hit blue error screens at the same time [2].
For security directors whose duress systems ran on that same network infrastructure, the outage proved what many had suspected: WiFi-dependent safety technology fails at the exact moment a facility is most chaotic.
That event accelerated a conversation that was already building. Psychiatric aides face workplace violence at roughly 39 times the national average [3]. The incidents concentrate in parking structures, stairwells, and outdoor transition areas, the same locations where WiFi signals degrade or disappear [4]. Peer security directors had been tracking that overlap for years. The outage shifted the conversation from “we should look at this eventually” to “we can’t justify not acting on it.”
Within months, the security directors who moved first were sharing results with peers at regional conferences and industry roundtables. The message was consistent: once you stop treating dead zones as a WiFi problem and start treating them as an architecture decision, the path forward gets simple.
What Peer Security Directors Stopped Doing
The shift wasn’t about finding better WiFi. It was about removing WiFi from the equation.
Security directors at peer facilities describe a common cycle: months spent coordinating with technology staff to extend network coverage to parking garages and outdoor areas, only to discover the new equipment still couldn’t hold a reliable signal through two floors of poured concrete. Buildings constructed decades ago with dense materials produce dead zones that no amount of network funding fixes [4].
What peers stopped doing versus what they started doing:
What peers stopped
What peers started
Requesting WiFi extensions to parking structures and outdoor areas
Evaluating safety systems that run on their own dedicated network
Waiting for technology staff to solve coverage gaps
Accepting vendor coverage claims based on lab conditions
Requiring site-specific verification with doors in locked position
Treating dead zones as an IT problem
Reframing dead zones as a solvable design problem
That last row is the core of the shift. The parking garage isn’t uncovered because your technology team failed. It’s uncovered because the system you chose depends on infrastructure that can’t reach it.
What Peer CSO Safety Insights Reveal After the Switch
The facilities that deployed WiFi-independent systems are reporting three things consistently.
Coverage that holds during outages. During a four-hour power outage at one facility, the safety system stayed live on battery backup with six to eight hours of reserve while WiFi went dark [5]. For security directors who had been managing around known gaps, that was the proof point that mattered most: the system worked when everything else didn’t.
Staff who actually carry and use devices. When coverage reaches every zone, staff behavior changes. Devices stop getting left in lockers. Reporting rates go up. Violence prevention committees stop hearing “what’s the point if it doesn’t work in the parking lot.”
A recruitment edge. This is the piece that surprised peer security directors. Nurses at competing facilities are asking during interviews whether the duress system works in the parking garage at shift change [6]. That level of specificity tells you what candidates have experienced at previous employers, or heard from colleagues who left. Facilities with visible, verified safety coverage are using it as a retention and recruitment tool in a market where staffing is already stretched thin.
The retention angle feeds back into everything else. Facilities with lower turnover have more experienced staff, better incident documentation, and stronger evidence packages when surveyors arrive. The safety investment pays forward in ways that don’t show up on the original budget request.
Worth noting: these outcomes come from early adopters. Facilities with unusual layouts, multi-level parking structures, or long outdoor corridors between buildings may see different timelines. But the direction is consistent across every peer deployment reported so far.
If your facility still runs WiFi-dependent safety systems, we can show you what peers switched to and why.
Joint Commission workplace violence prevention standards took effect in July 2024 for behavioral health settings [7], and surveyors are increasingly asking for coverage proof in parking structures and outdoor areas. Security directors at peer facilities aren’t just meeting that standard. They’re documenting performance data that goes beyond what surveyors require.
The gap between early movers and everyone else is widening. Peer facilities that switched to WiFi-independent systems are now in their second year of documented performance data. They have:
Before-and-after incident comparisons
Coverage verification records for every zone
Response time metrics broken out by facility area
Facilities still running WiFi-dependent systems will be starting from scratch.
Peer facilities are documenting outcomes, winning staffing battles, and passing surveys with evidence packages that leave nothing for assessors to question.
Your facility’s dead zones, the parking structure, the stairwell between units, the outdoor courtyard, don’t have to stay that way. Peer CSO safety insights point to one consistent conclusion: the architecture to close those gaps exists, and the facilities that adopted it are already documenting the results.
STAFF SAFETY
Your Peers Already Made the Switch
Security directors at peer facilities deployed WiFi-independent safety systems and are documenting the results. See what that looks like for your facility.
Bluetooth panic button systems work differently depending on their underlying architecture. The questions below cover how these systems perform in facilities without reliable WiFi, what separates standalone wireless networks from WiFi-dependent approaches, and what technical and security leaders need to evaluate before choosing a system. This bluetooth panic button FAQ draws from documented deployment data and published guides across this topic area.
What is a Bluetooth panic button and how does it work?
A Bluetooth panic button is a wearable device that sends a distress signal over a wireless network when pressed. In standalone BLE mesh systems, battery-powered beacons placed throughout a facility form their own network. That network operates independently of facility WiFi, so the signal reaches responders even in areas where internet connectivity drops. The alert includes the staff member’s location, typically accurate to the room level.
Why do WiFi-dependent panic buttons fail in behavioral health facilities?
WiFi-dependent systems fail because the buildings themselves block the signal. Behavioral health facilities use reinforced concrete, thick fire doors, and signal-dampening construction designed for patient safety. These materials create dead zones in stairwells, parking structures, and older wings, the same locations where violence incidents cluster most.
What is BLE mesh and how is it different from WiFi?
BLE mesh is a standalone wireless network built from battery-powered beacons. Each beacon relays signals to nearby beacons, creating a self-healing chain that routes around obstacles. Unlike WiFi, it requires no wiring, no access points, and no connection to clinical networks. If one beacon fails, neighboring beacons reroute the signal automatically.
Do Bluetooth panic buttons work during power outages?
Yes. Battery-powered BLE mesh beacons keep operating when facility power goes down. During a documented four-hour outage at one facility, the safety system stayed live on battery backup with six to eight hours of reserve while WiFi access points went dark. Healthcare facilities average more than seven power events per year, making outage resilience a critical requirement.
What areas can Bluetooth panic buttons cover that WiFi can’t?
Standalone BLE mesh covers parking structures, stairwells, elevator cabs, outdoor courtyards, and older building wings. These are the exact zones where WiFi drops and where incident reports show violence concentrates. Verified deployments confirm room-level accuracy across all these areas. Coverage reaches every zone staff actually work in, not just the zones where WiFi happens to reach.
How long does it take to deploy a Bluetooth panic button system?
BLE mesh systems deploy in days to weeks for a typical facility. A 100-room facility can be fully covered in two to three days of beacon placement. There’s no wiring, no construction, and no disruption to patient care during setup. WiFi-dependent and hardwired alternatives often take months and carry retrofit cost premiums of 25–40%.
Will a Bluetooth panic button system affect our clinical network?
A standalone BLE mesh system runs on its own private network. It shares zero bandwidth, zero infrastructure, and zero added security risk with clinical systems. Deployments carry HITRUST r2 and SOC 2 Type II certification on a dedicated network. Your technology team gains a safety system without adding load to the network they already manage.
What uptime should we expect from a Bluetooth panic button system?
Life-safety systems in healthcare require 99.9% uptime, which allows roughly 52 minutes of downtime per year. WiFi typically delivers 95–99% availability, translating to 36–87 hours of annual downtime. Standalone BLE mesh deployments document 99.9% SLA-verified uptime. The difference between those two numbers is measured in days, not minutes.
How do I evaluate Bluetooth panic button vendors?
Start with your facility, not the vendor brochure. Overlay your RF heat map with your incident location data. That one-afternoon analysis reveals where dead zones and assaults overlap. Then ask vendors for documented uptime records, site walkthrough results, current security certifications, and performance data from comparable facilities. The distinction between “targets 99.9%” and “documents 99.9%” separates strong vendors from weak ones.
What should a CTO prioritize when assessing these systems?
Prioritize infrastructure independence and documented evidence over vendor projections. Peer CTOs at leading behavioral health facilities focus on outage records, site walkthroughs, and current certifications rather than feature lists. Behavioral health technology teams typically run with 15–25 staff, so deployment speed and maintenance burden matter as much as coverage. Ask whether the system works in your building, not whether it works in a demo.
What should a CSO prioritize when assessing these systems?
Prioritize coverage proof in the specific zones where your staff are most at risk. Parking lots account for roughly one in four healthcare violence incidents, and stairwells rank among the highest-risk areas for staff injury. Peer security directors shifted from treating dead zones as a WiFi problem to treating them as an architecture decision. Ask vendors to prove coverage in your parking structure, your stairwells, and your outdoor transition areas.
How does a Bluetooth panic button system help with Joint Commission compliance?
Joint Commission workplace violence prevention standards took effect in July 2024 for behavioral health settings. These standards require proof that safety systems cover all areas where staff work, including parking structures and outdoor zones that WiFi often misses. Verified coverage data, uptime records, and incident response logs form the evidence package surveyors expect. Loss of accreditation puts Medicare and Medicaid funding at risk.
What does a Bluetooth panic button system cost?
Capital hardware cost runs around $182 per badge with no wiring and no construction. Standalone BLE mesh avoids the ongoing costs of WiFi access point expansion and the 25–40% retrofit premiums that hardwired systems carry. Total cost of ownership depends on facility size and architecture choice. A site assessment builds the specific cost picture before any purchase commitment.
How do I build the internal business case for this system?
Start by overlaying 12 months of incident data against your current coverage map. That overlay shows leadership exactly where staff are unprotected and turns a technology request into a documented risk. Frame the first ask as approval for a site assessment, not a purchase. Once the assessment confirms what the data already shows, the evidence builds the rest of the case.
Can staff trust that the system will work when they need it?
Staff already know where the dead zones are. They avoid certain stairwells, they walk in pairs through parking lots, and they tell new hires which areas to watch. When a system provides verified coverage in every one of those zones, trust follows. One facility reported a 38-point jump in staff responses to “I feel safe at work” after deploying full coverage.
What happens if a beacon in the BLE mesh network fails?
The mesh self-heals. Neighboring beacons automatically reroute the signal around the failed node. This means a single point of failure doesn’t create a coverage gap. The stress-scenario performance data for BLE mesh confirms continued operation through node failures, power outages, and network disruptions. Battery-powered beacons also eliminate dependence on facility electrical infrastructure.
The building materials that define behavioral health facilities block WiFi signals, creating dead zones in the exact locations where staff face the greatest risk.
A bluetooth panic button comparison across WiFi-dependent, hardwired, and standalone BLE mesh architectures shows that each carries a structural limitation that determines where it works and where it fails.
The architecture that fits your facility depends on your building construction, your coverage needs, and the technology resources you can realistically commit.
The dead zones in your facility tell the real story. The stairwell where WiFi drops. The parking lot where coverage ends at the building wall. The older wing where concrete and steel block signals that work fine in the administrative corridor. These are where staff get hurt, and where a bluetooth panic button comparison actually matters.
In behavioral health settings, violence rates are the highest in healthcare [1]. Those incidents cluster in the spots where coverage is weakest. Comparing WiFi-dependent, hardwired, and standalone BLE mesh architectures against those realities reveals which systems work in your environment and which don’t.
Why the Architecture Choice Determines Coverage
Behavioral health facilities operate in buildings designed to contain patients, not transmit wireless signals. Concrete block walls, metal framing, reinforced doors, and lead-lined barriers all weaken WiFi significantly [2]. The effect compounds through multiple barriers: a locked unit behind two corridor walls and a fire door blocks enough signal to turn a covered hallway into a dead zone.
These are permanent features of the buildings, not problems a network upgrade solves. The architecture you choose for your safety system either works within those constraints or fails against them.
Joint Commission standards effective July 2024 require behavioral health facilities to prove safety system coverage throughout all areas where staff work, including outdoor areas and parking facilities [3]. The architecture determines whether your system meets that standard or leaves documented gaps.
Bluetooth Panic Button Comparison: Three Architectures
The following table maps each architecture against the dimensions CTOs evaluate during selection.
Dimension
WiFi-Dependent
Hardwired (IR)
Standalone BLE Mesh
Coverage
Limited to WiFi footprint; dead zones in stairwells, parking, outdoors
Building interior only; no outdoor coverage
Full facility including parking lots, stairwells, outdoor areas [4]
Reliability
Fails during network outages
Interference-proof within covered areas
Self-healing mesh; 99.9% SLA-verified uptime [4]
Infrastructure dependency
Requires robust WiFi; adds load to clinical network
Two patterns stand out. WiFi-dependent and hardwired systems each carry a structural limitation that can’t be engineered away: WiFi fails during outages, and hardwired can’t extend outdoors.
The 99.9% uptime figure comes from a single vendor’s deployment data [4]. No independent third-party audit has been published, and competitors haven’t documented equivalent metrics. That asymmetry makes a true side-by-side reliability comparison difficult. It also raises a fair question: why hasn’t the rest of the category published anything?
Performance Under Stress
The real test of any architecture is what happens when conditions deteriorate.
Stress Scenario
WiFi-Dependent
Hardwired
Standalone BLE Mesh
Facility-wide power outage
Fails unless access points are on backup generators (many aren’t)
Healthcare facilities experience more than seven power events per year in core systems, with nearly five total facility shutdowns annually [8]. These are annual events, not edge cases.
During a documented four-hour power outage, one BLE mesh deployment operated continuously with up to eight hours of battery reserve while WiFi went dark [4]. That’s the difference between an architecture that depends on facility infrastructure and one that doesn’t.
What Each Architecture Demands From Your Technology Team
Behavioral health technology budgets run 15 to 25 percent below comparable acute care hospitals on a per-bed basis [9]. The architecture you select has to fit the resources you actually have.
For facilities facing Joint Commission survey timelines or responding to incident trends, deployment speed determines how long the coverage gap stays open. Days-to-weeks timelines assume the vendor walks the facility first, not just ships hardware.
Many facilities discover their infrastructure constraints eliminate one or two options before technical evaluation begins. If your buildings are older than 30 years, you need outdoor coverage, and your technology team is stretched, the comparison narrows quickly.
The bluetooth panic button comparison that matters is the one measured against your walls, your dead zones, and the locations where your staff actually work. The stairwell where WiFi drops and the parking lot where coverage ends at the building wall are the evaluation criteria, not problems to solve later.
ARCHITECTURE COMPARISON
Which Architecture Fits Your Facility?
Compare WiFi-dependent, hardwired, and standalone BLE mesh against your building, your dead zones, and your technology resources.
The coverage gaps on your RF heat map are the same locations on your incident reports, and that overlap is the strongest argument for infrastructure-independent safety architecture.
Presenting the case internally requires translating technical architecture into risk reduction, cost comparison, and documented performance evidence leadership can act on.
The most common objections from leadership have clear, evidence-backed answers that a prepared CTO can address in a single meeting.
Your CSO requests safety coverage in the B-wing stairwell. Your RF heat map confirms it is a dead zone. The vendor’s WiFi-dependent system cannot reach it.
This bluetooth panic button technical brief helps you package that problem and its solution into an internal recommendation your leadership team can approve.
The Risk Your Current System Creates
Psychiatric aides experience workplace violence at 543.6 cases per 10,000 workers, the highest rate of any occupational group [1]. The incidents concentrate in stairwells, seclusion rooms, and outdoor walkways where WiFi coverage is weakest.
For leadership, the framing is straightforward: the safety system you approved works in the administrative corridors. It fails in the stairwell where your staff member was assaulted last quarter. That is an organizational risk, not a technology inconvenience.
The Architecture Difference in One Paragraph
BLE mesh architecture runs on its own private network, completely independent of facility WiFi. Battery-powered beacons form a self-healing mesh that covers every area of the facility, including parking lots, stairwells, and outdoor zones WiFi cannot reach. During a four-hour power outage at one facility, the mesh kept operating while WiFi went down [4]. For the full technical comparison of WiFi-dependent, hardwired, and BLE mesh approaches, see the bluetooth panic button guide.
The Evidence Summary for Your Recommendation
When you present to leadership, these are the numbers that matter:
What Leadership Asks
What You Can Show
Does it actually work in our dead zones?
100% facility coverage verified through site surveys with room-level accuracy, including parking lots, stairwells, and outdoor areas [4]
How reliable is it?
99.9% SLA-verified uptime across behavioral health deployments, meeting the healthcare life-safety threshold [4][5]
Objections You Will Hear (And How to Address Them)
“Why can’t we just extend WiFi to those areas?”
The construction materials that create dead zones (concrete, metal-reinforced doors, ligature-resistant hardware) are permanent features of behavioral health facilities [2]. Adding access points helps in some areas but cannot solve structural signal loss through dense walls and locked doors. The dead zones are architectural, not coverage configuration problems.
“What about our existing investment in WiFi infrastructure?”
BLE mesh runs on a separate private network. It does not replace, modify, or add load to your existing WiFi. Your current infrastructure stays exactly as it is. The mesh operates alongside it for safety-specific functions only.
“You are not asking leadership to approve a purchase. You are asking them to approve a site assessment that will confirm whether the coverage gaps on your heat map match the incident patterns in your data.”
“What is the ongoing maintenance burden for our technology staff?”
Battery-powered beacons last multiple years between replacements. The mesh is self-healing, meaning it reroutes automatically when a beacon goes down. There is no ongoing network management, no access point monitoring, and no clinical system integration burden beyond initial setup.
“How do we know the vendor’s claims hold up?”
Request documented, SLA-verified uptime from comparable behavioral health deployments. Require a site survey conducted under realistic conditions (doors locked, equipment running). Ask for evidence from an actual power outage event. The CTO evaluation checklist provides the full framework for verifying vendor claims.
The coverage gaps on your heat map already tell the story. See what closing those gaps looks like with a site assessment.
Your internal brief should fit on one page and cover five points:
The problem: Dead zones on your RF heat map overlap with high-incident locations. Your current safety system fails in those areas.
The risk: Staff are unprotected in the locations where violence is most likely. Regulatory standards now require documented coverage across all facility areas [7].
The solution: Infrastructure-independent BLE mesh architecture that covers every zone without touching your clinical network.
The evidence: Documented uptime, coverage, and deployment data from comparable behavioral health facilities.
The ask: Approval to proceed with a site assessment that documents your specific coverage gaps before any deployment commitment.
That last point matters. You are not asking leadership to approve a purchase. You are asking them to approve a site assessment that will confirm whether the coverage gaps on your heat map match the incident patterns in your data. The evidence does the rest.
SITE ASSESSMENT
Ready to Build the Internal Case?
ROAR's behavioral health technology specialists help CTOs document coverage gaps and build the evidence brief for leadership approval. Start with a site assessment that confirms whether your dead zones match your incident data.
Technology leaders at behavioral health facilities are shifting their evaluations from feature comparisons to infrastructure independence, driven by the overlap between dead zones and incident locations.
The peer benchmark for approval is documented evidence from comparable deployments, not vendor targets or portfolio-wide averages.
Behavioral health facilities with limited technology staff are choosing architecture that deploys in days and runs independently, because evaluation cycles that stall for months never reach deployment.
Your coverage map looks great on paper. Then you pull up the incident data and realize assaults cluster in the exact spots where WiFi drops: stairwells, parking lots, the walkway between buildings.
That is the gap peer CTOs at behavioral health facilities keep running into. And it is why peer CTOs have landed on a consistent approach to evaluating WiFi-independent safety systems.
Why the Coverage Map Stopped Being Enough
The infrastructure behind this shift is straightforward. Healthcare facility age metrics have risen from 8.6 years in 1994 to over 11 years by 2015, with many buildings past the point where infrastructure works reliably [1].
These buildings were built for durability and patient safety. Wireless signals were never part of the design. WiFi coverage maps rarely align with incident location data.
Government-sector mental health workers experience the highest rate of nonfatal workplace violence at 77.1 incidents per 1,000 workers [2]. Those incidents concentrate where WiFi coverage fails: stairwells, parking lots, outdoor transition areas, and older wings with dense construction materials [3].
“The moment that changes the conversation is the overlay. Pull up heat maps of where assaults occur, then lay WiFi signal strength over the same corridors and stairwells. The gaps line up almost perfectly.”
The moment that changes the conversation is the overlay. Pull up heat maps of where assaults occur, then lay WiFi signal strength over the same corridors and stairwells. The gaps line up almost perfectly. That single visualization moves the evaluation from “we should look into this” to “we need to solve this.”
What Peer Evaluations Focus On (And What They Skip)
Technology leaders at top-performing facilities follow a consistent evaluation approach. They test five specific claims against documented evidence.
What peers prioritize:
Outage records over uptime targets. Peers ask vendors for uptime records from facilities like theirs, not portfolio-wide averages that can mask poor performance at individual sites. The distinction between “targets 99.9%” and “documents 99.9%” is where peer evaluations separate from typical vendor evaluations.
Site walkthroughs over coverage diagrams. Peers require signal testing with metal-reinforced doors closed and locked, not propped open during a demo walkthrough. Marketing diagrams do not substitute for someone walking the grounds with a signal meter.
Current certifications over compliance roadmaps. Peers require current HITRUST r2 and SOC 2 Type II, independently verifiable. “In progress” is not a certification [4][5].
System integration over feature counts. Peers check whether alert data flows to their existing incident management and nurse call systems [6]. A long feature list means nothing if the system cannot connect to the tools your clinical and security teams already use.
Comparable facility data over general case studies. Peers ask for site survey results from facilities with similar construction materials, building age, and campus layout to theirs.
For the full evaluation framework covering all five categories with specific evidence requests, see the bluetooth panic button guide. For a step-by-step process to run the evaluation internally, see the CTO evaluation checklist.
What peers stopped doing is equally telling. They stopped asking “what features does it have?” and started asking “can you prove it works in a building like mine?”
The Walkthrough That Changes the Conversation
Peer CTOs describe a consistent pattern when they physically test coverage claims.
The transition zone between a building’s main entrance and the parking structure is often 40 to 60 feet of no coverage under WiFi-dependent systems. Peers who walked this zone with a signal tester found the gap was larger than any vendor diagram suggested.
BLE mesh architecture addresses this differently. Battery-powered beacons placed through the transition zone, parking structure, and outdoor walkways provide coverage without any WiFi dependency. Verified deployments confirm 100% facility coverage through site surveys with room-level accuracy [7].
The power outage test is the other proof point peers cite consistently. During a four-hour power outage at one facility, WiFi access points went down. The BLE mesh kept operating with up to eight hours of battery life [7]. Peers describe that moment as when the architecture difference became real.
Beacon placement eliminates the transition zone vulnerability. But coverage still requires a physical site survey under realistic conditions. Peers who skipped the walkthrough and relied on vendor diagrams regretted it.
Peer CTOs started with one step: overlaying incident data onto their coverage map. See what that analysis reveals for your facility.
How Peers With Stretched Technology Staff Made the Decision
Behavioral health facilities typically run technology operations with 15 to 25 staff, compared to 50 to 100 or more in comparable acute care settings [1]. That number shapes every technology decision.
Peers in this position describe the same calculus: a system that requires months of network planning and ongoing technical maintenance will stall in evaluation indefinitely. Their teams are already stretched. The deciding factor was deployment speed and maintenance burden.
What peers at comparable facilities report from their deployments:
Time to value under six months from initial assessment to full operation [7]
Zero disruption to patient care during setup [7]
No wiring, no network configuration, no additional infrastructure burden on clinical systems
Battery-powered beacons with multi-year life, eliminating ongoing maintenance cycles
Deployment measured in days of beacon placement, not months of network planning
Results will vary based on facility size, building materials, and how many legacy systems your team already supports. But the peer pattern is clear: leaders chose architecture that could be operational before their next board meeting.
Peer CTOs at top-performing behavioral health facilities share a common approach: they focus on infrastructure independence over vendor promises, require documented performance data over projected targets, and validate coverage through site walkthroughs rather than marketing materials.
PEER INSIGHTS
Ready to See How Your Coverage Compares?
ROAR's behavioral health technology specialists work with CTOs at facilities like yours. For technology leaders evaluating WiFi-independent architecture, we provide site assessments that document coverage gaps before deployment.
The strongest bluetooth panic button evaluation starts with your own facility data, not a vendor brochure. Overlay your incident locations onto your RF coverage map before the first call.
Assign evaluation ownership across CTO, IT Director, CISO, and CSO before engaging vendors so each stakeholder knows what they are validating.
Phase deployment by risk priority, starting with the dead zones where incidents already cluster, and set decision gates that require documented evidence rather than projected targets.
Your next bluetooth panic button evaluation will come down to one question: will the system actually work where WiFi does not?
You already know the answer for most of your building. The nurse stations are fine. The admin corridors are fine. But the stairwell behind the locked unit? The outdoor smoking area? The parking garage? Those are the spots where incidents happen. And those are the spots where WiFi drops.
This guide walks through how to run your evaluation as an internal project, from facility assessment through vendor selection to deployment.
Start With Your Facility, Not the Vendor Brochure
Psychiatric and substance abuse hospitals recorded 110.4 violence incidents per 10,000 workers [1]. Emergency departments account for 30% of active shooter incidents in hospitals, followed by patient rooms at 21% and parking lots at 15% [2].
Incidents cluster in stairwells, smoking areas, and the spaces between buildings that never got access points.
Many psychiatric hospitals were built in the 1950s through 1980s using dense materials for durability and security [3]. These buildings were never designed for WiFi. Behavioral health facilities compound the challenge with older IT infrastructure and limited technology staff [3][4].
Before evaluating any vendor, check your baseline:
Can you produce a current RF heat map showing dead zones overlaid with incident location data from the past 12 months?
What percentage of your facility square footage has reliable WiFi coverage in locked-door and outdoor areas?
If you cannot answer both, that is your first action item.
Build Your Coverage Requirements Document
Your evaluation needs a written requirements document before the first vendor conversation. Your IT Director, CISO, and CSO will reference it throughout.
Facility profile (document per building on campus):
Construction era and primary materials (concrete block, steel framing, masonry)
Number of floors, locked units, and ligature-resistant areas
Known dead zones from most recent RF survey
Outdoor areas requiring coverage (parking structures, courtyards, walkways between buildings)
Infrastructure constraints:
Current WiFi coverage percentage in locked-door and outdoor areas
Network capacity for an isolated VLAN, or whether full network independence is required
Technology staff capacity for new system deployment and maintenance
Electrical infrastructure age and power outage frequency
Performance requirements:
Minimum uptime standard (healthcare life-safety threshold is 99.9%) [5]
Coverage verification method (site survey with doors closed and locked, not just open)
Power independence requirement (how many hours of battery backup given your outage history)
This document becomes the scorecard every vendor is measured against. Without it, evaluations turn into feature comparisons that tell you nothing about whether the system fits your buildings.
Run the Dead Zone / Incident Overlap Analysis
This is the single most valuable pre-evaluation step. It takes one afternoon and changes the entire conversation.
Pull 12 months of incident location data from your security director
Overlay incident locations onto your current RF heat map
Identify your three highest-risk dead zones by comparing where incidents happen most with where signal is weakest
Walk those three locations with a signal tester under realistic conditions (doors locked, equipment running)
Document findings as a one-page brief with the overlay visualization
The pattern is consistent: the dead zones and the high-incident zones overlap. That overlap is your business case and the first thing you show any vendor.
For multi-site organizations, this analysis must be site-specific. A coverage map from one facility tells you nothing about another.
Request a site survey proposal that specifies testing under locked-door conditions
Weeks 5-6: Decision gate
Score vendors against your requirements document
Confirm that the recommended vendor meets the 99.9% uptime life-safety threshold with documented, not projected, evidence [5]
Present recommendation with your dead zone overlay, requirements scorecard, and vendor comparison
Phase 1 deployment: Start with your three highest-risk dead zones. Battery-powered beacons with no wiring enable deployment without clinical disruption [7]. Expand coverage facility-wide in Phase 2 based on Phase 1 results.
You do not need to fix everything before your first vendor call. Start with that RF heat map overlaid with incident data. That single document will tell you more about your bluetooth panic button evaluation priorities than any vendor slide deck.
EVALUATION SUPPORT
Ready to Start Your Bluetooth Panic Button Evaluation?
ROAR's behavioral health technology specialists can walk through your facility constraints and help you build the requirements document before your first vendor call.
WiFi infrastructure falls far short of the uptime threshold healthcare safety systems require, and the gap translates to dozens of hours per year when staff alerts can’t get through.
Documented bluetooth panic button data from WiFi-independent deployments shows the only published performance metrics in this category, filling an evidence gap no competitor has addressed.
The consolidated numbers tell a single story: WiFi-independent architecture delivers measurable, verifiable reliability in the exact environments where WiFi-dependent systems fail.
WiFi infrastructure in healthcare runs at roughly 95 to 99 percent availability [1]. That sounds acceptable until you calculate what it means: somewhere between 36 and 87 hours per year when a WiFi-dependent safety system can’t process alerts. For behavioral health facilities where violence rates are the highest in healthcare [2], those hours represent gaps in staff protection that no amount of network tuning closes.
This bluetooth panic button data brief compiles the documented performance metrics, the industry benchmarks that contextualize them, and the evidence gap that defines the competitive landscape.
The Cost of WiFi-Dependent Safety Systems
Healthcare mission-critical systems require at least 99.9 percent availability, which allows roughly 52 minutes of downtime per year [1]. WiFi falls short by orders of magnitude. The gap between what WiFi delivers and what safety systems require is measured in days, not minutes.
The cost goes beyond downtime. Healthcare network upgrades run anywhere from $100,000 to $500,000 depending on facility size and building complexity [3]. That investment improves WiFi coverage. It doesn’t fix the structural problem underneath.
Behavioral health facilities use concrete block walls, metal framing, reinforced doors, and lead-lined barriers [4]. These materials are chosen for patient safety and infection control, not wireless performance. Adding more access points to buildings designed to block wireless signals is an ongoing cost with diminishing returns.
Meanwhile, workplace violence costs U.S. hospitals more than $18 billion annually [5]. When staff press a button during those 36 to 87 hours of WiFi downtime, nothing happens.
Bluetooth Panic Button Data: WiFi-Independent Performance
Documented deployment data confirms 99.9 percent SLA-verified uptime, the only published uptime metric in this technology category [6].
These metrics reflect a standalone private network operating independently of hospital WiFi. When individual beacons fail, the mesh routes around them automatically. That eliminates the single point of failure that WiFi-dependent designs carry.
The 93 percent resolution rate holds across all facility zones, including areas with the densest construction materials [6]. The remaining incidents still resolve, just outside the two-minute window, typically in outdoor perimeter zones where responder travel distance is the limiting factor rather than system performance.
No competing vendor publishes comparable performance data. That transparency gap is itself informative.
Coverage Where WiFi Can’t Reach
Violence in healthcare doesn’t stay in patient rooms. The highest-risk locations include:
Emergency departments (roughly three in ten active shooter incidents in hospitals) [5]
Parking lots (about one in seven, and among the most common locations for violent crimes nationally) [5] [7]
A CTO needs verified coverage in every one of these areas.
Psychiatric units present worse wireless conditions than general hospital environments. Dense construction materials chosen for patient containment block signals that other facility types take for granted. Site surveys in behavioral health buildings routinely reveal dead zones within feet of high-risk areas. These are structural realities of the buildings, not gaps in technology planning.
Documented BLE mesh deployments deliver 100 percent facility coverage verified through site surveys, including parking lots, stairwells, and outdoor areas where WiFi doesn’t reach [6]. Alert-log analytics confirm consistent response times regardless of zone [6].
One qualification: “100% coverage” means verified during the site survey. Facilities that undergo significant construction or layout changes after the survey would need re-verification.
Healthcare facilities experience more than seven power events per facility per year in core systems, with nearly five total facility shutdowns annually [8]. When backup generators fail or extreme weather takes down power infrastructure, WiFi-dependent safety systems fail at the same moment staff need them most.
Documented deployment data shows uninterrupted operation during a four-hour power outage, with fully charged devices lasting six to eight hours on battery [6]. Battery-powered beacons require no wiring. The mesh keeps processing alerts independent of facility power and network infrastructure.
One practical note: the six-to-eight-hour window assumes devices started fully charged. Facilities running consecutive shifts without a charging protocol could see shorter runtimes. The architecture holds up under stress, but it still requires basic operational discipline around charging.
If you need documented performance data for your business case, we can walk you through what these numbers look like at your facility.
The Evidence Summary: What the Numbers Prove Together
Category
Metric
Value
Uptime
SLA-verified availability
99.9% (52 min downtime/year) [6]
Coverage
Facility zone verification
100%, verified in site surveys [6]
Response
Incidents resolved under 2 min
93% [6]
Battery backup
Operation during power outage
6–8 hours [6]
Deployment cost
Per-badge capex
$182 [6]
Time to value
Full deployment
Under 6 months [6]
Regulatory
Joint Commission/OSHA audits
100% passed, zero citations [6]
Each row answers a question an executive or a surveyor will ask. Together they prove four things:
Uptime that meets the healthcare mission-critical threshold WiFi can’t reach
Coverage verified in every zone, including the ones WiFi-dependent systems miss
Resilience through power outages that take down WiFi and facility networks
Deployment cost and timeline that fit behavioral health budgets
The evidence gap matters as much as the evidence itself. No competing vendor publishes comparable bluetooth panic button data across infrastructure types. Facilities evaluating alternatives are comparing documented performance against vendor projections, not against equivalent published data. That gap is the strongest argument in the business case: you can verify these numbers. Ask any competing vendor to match them.
Documented bluetooth panic button data: 99.9% uptime, 100% verified coverage, and proven operation through power outages. No competing vendor publishes comparable metrics.
When a safety system fails in a dead zone, the CTO who approved it owns that failure. Architecture choice is a career decision, not just a technical one.
WiFi-dependent systems inherit every coverage gap in your facility, leaving the highest-risk areas unprotected by the technology you signed off on.
Documented, independently verifiable performance data across every facility zone is what separates a confident recommendation from a hopeful one.
The dead zones in your facility are not a surprise. You mapped them during the last network assessment. The B-wing stairwell. The parking structure. The outdoor courtyard between buildings. You also know those spots overlap almost perfectly with the highest-risk areas on your incident reports.
The bluetooth panic button confidence you need before recommending a safety system to your executive team requires more than a vendor’s assurance. It requires architecture that works where your network does not reach. And the gap between “works in the demo” and “works at 2 AM in the stairwell” is where reputations get made or quietly destroyed.
The Fear CTOs Carry Quietly
Psychiatric aides experience workplace violence at rates 69 times higher than the national average [1]. When a staff member presses a panic button in a stairwell and nothing happens, the damage extends beyond a single incident.
Only 12 to 23 percent of workplace violence incidents get formally reported [2]. Systems that fail in dead zones reinforce the belief that reporting is futile. That already-low percentage drops even lower. Eventually staff stop carrying the devices altogether.
The Joint Commission released new workplace violence prevention standards for behavioral health settings [3]. The pressure arrives from multiple directions at once:
Your board chair asks about accreditation readiness under the new standards
Your CNO mentions the incident the system did not catch in the B-wing stairwell
Your security director reports that staff in certain areas have stopped carrying the devices because they know the signal will not reach
This is the fear CTOs carry quietly. Not that the technology is flawed in theory. That the physical reality of your facility will expose its limits at the worst possible moment.
No one should face violence because a signal could not reach through a concrete wall.
Why the Problem Feels Personal
The construction materials specified for patient safety are the same materials that block the signals staff depend on for their own protection. Concrete walls, metal-reinforced doors, and security hardware standard in behavioral health create predictable dead zones [4].
Rural and community behavioral health settings face compounding challenges. Some hospitals report internet speeds at a fraction of what modern operations need [5]. Psychiatric and substance abuse hospitals experience violence at 110.4 incidents per 10,000 workers [6].
The locations where WiFi fails and the locations where violence occurs are the same locations, mapped onto the same floor plan. A WiFi-dependent safety system inherits every weakness of your network. Dead zones become safety gaps. Coverage maps become liability maps.
“That shift, from I hope it works there to I can show it works there, is where bluetooth panic button confidence actually begins.”
And those liability maps have your signature on the vendor approval.
What Changes When the Architecture Works Independently
A standalone BLE mesh network operates on a private network independent of hospital WiFi. Battery-powered beacons form a self-healing mesh that reroutes signals automatically when individual nodes fail. No WiFi dependency. No single point of failure.
Verified deployments confirm 100% facility coverage through site surveys with room-level accuracy, including parking lots, stairwells, and outdoor areas WiFi cannot reach [7]. The mesh reconfigures automatically when a beacon fails. No IT ticket. No coverage gap during the reroute.
What that means for the CTO:
The B-wing stairwell where your WiFi drops out: now a covered zone
The parking lot at shift change: now a covered zone
The outdoor courtyard between buildings: now a covered zone
Every area on your dead zone map: an area where the system works
That shift, from “I hope it works there” to “I can show it works there,” is where bluetooth panic button confidence actually begins.
The dead zones on your coverage map do not have to stay that way. See what documented coverage looks like across every facility zone.
HITRUST r2 and SOC 2 Type II certified, zero added security risk to clinical systems [9]
Does it cover the dead zones?
100% facility coverage verified through site surveys, including parking lots, stairwells, outdoor areas [7]
These are the numbers that hold up in a board presentation. The kind of evidence that lets a CTO say “I vetted this thoroughly” and mean it.
What This Means for Your Next Executive Review
Behavioral health technology teams are already stretched. BLE mesh beacons deploy with no wiring, no network configuration, and no additional infrastructure burden [10]. Facility managers report zero disruption to patient care during setup [7]. The deployment itself takes days, not months.
The harder question is the one your CNO asks after the next incident in a dead zone. Not “what technology do we have?” but “why does it fail in the places where incidents happen?”
That question has an answer now. BLE mesh architecture works independently of the WiFi infrastructure you already know is insufficient. It delivers documented reliability across every area of your facility, including the ones that keep showing up on incident reports.
Staff who work in the stairwell at 2 AM, the parking lot at shift change, and the courtyard during patient transport deserve a system that works in those locations. Bluetooth panic button confidence comes from architecture that never depends on infrastructure you have already mapped as unreliable.
Your recommendation should feel as solid as the evidence behind it.
COVERAGE PROOF
Ready to Close the Gap Between Your Dead Zone Map and Your Incident Reports?
ROAR's behavioral health technology specialists understand the infrastructure constraints that create coverage gaps. For CTOs evaluating WiFi-independent architecture, we provide site assessments that document dead zones before deployment.
The facilities where staff face the highest risk of violence are built with the same dense materials that block WiFi signals, creating dead zones where safety systems fail silently.
BLE mesh architecture operates independently of facility WiFi, forming self-healing networks that provide verified coverage in parking lots, stairwells, and outdoor areas traditional systems cannot reach.
Evaluating any bluetooth panic button system requires scrutiny of infrastructure dependency, security architecture, failover design, and documented coverage proof rather than vendor marketing claims.
The locations flagged as highest-risk on incident reports overlap almost perfectly with the locations flagged as dead zones on RF heat maps. Stairwells. Courtyards. Parking lots. Transition corridors between locked units. In behavioral health facilities, the construction that keeps patients safe is the same construction that blocks wireless signals. That overlap is the core infrastructure problem every CTO evaluating a bluetooth panic button system needs to solve.
“The locations flagged as highest-risk on incident reports overlap almost perfectly with the locations flagged as dead zones on RF heat maps.”
Why WiFi-Dependent Safety Systems Fail in Behavioral Health
In 2022, healthcare workers accounted for 73% of all nonfatal workplace violence injuries. The rate: 9.8 per 10,000 workers, compared to 1.9 across all private industry [1]. Psychiatric and substance abuse hospitals face even greater exposure, with 110.4 incidents per 10,000 workers [2]. The Joint Commission released new workplace violence prevention standards in July 2024, specifically for behavioral health and human services organizations [3].
The infrastructure reality is equally clear. Behavioral health facilities have dead zones where WiFi and cellular signals drop out entirely [4]. Concrete pillars can completely stop WiFi signals, and multi-floor buildings with dense interior layouts create areas where signals pass through wall after wall [5]. Psychiatric hospitals operate in older buildings retrofitted for behavioral health, featuring concrete and masonry construction and metal-reinforced doors [6][7].
These are the defining physical traits of the environments where staff safety technology must work. When 81% of workplace violence incidents already go unreported [8], a system that fails silently in a dead zone reinforces the belief that reporting is futile.
Three Architectural Approaches: BLE Mesh vs. WiFi-Dependent vs. Hardwired
Three fundamental approaches to bluetooth panic button connectivity exist. Each involves genuine tradeoffs.
WiFi-dependent systems use existing wireless networks to transmit alerts. If you already have WiFi, the added infrastructure cost appears low. The limitation: the safety system inherits every weakness of your network. Dead zones become safety gaps. Network congestion delays alerts. Power outages that take down access points take down the safety system at the same time.
Hardwired systems eliminate wireless dependency by running physical cable to each alert point. Within covered rooms, reliability is genuine. The tradeoffs are significant: cable runs, conduit work, and wall penetration in ligature-resistant environments take weeks to months. Outdoor areas, parking lots, stairwells, and transition spaces between buildings cannot be covered. The capital investment is substantial, and expanding coverage to new areas requires new construction.
“During a 4-hour power outage at one facility, the BLE mesh continued operating because its infrastructure does not depend on facility power.”
BLE mesh architecture takes a different approach. Bluetooth Low Energy mesh lets devices relay signals to each other instead of requiring a direct connection to a single access point [9]. BLE signals reach 30 to 100 meters in healthcare buildings, depending on how the beacons are configured [10]. Concrete walls weaken BLE signals by about 10 to 15 dB, and metal-reinforced doors create 20 to 30 dB loss [9]. The mesh compensates by routing signals through multiple beacon paths.
Evaluation Criteria
WiFi-Dependent
Hardwired
BLE Mesh
Infrastructure dependency
Requires existing WiFi coverage
Requires physical cable runs
Battery-powered beacons, no wiring
Outdoor/parking coverage
Limited to WiFi range
Not feasible
Covered through beacon placement
Deployment timeline
Days to weeks (network dependent)
Weeks to months
Days
Power outage behavior
Fails when WiFi fails
Operates if on backup power
Battery-powered, operates independently
Dead zone handling
Mirrors network dead zones
N/A (covered rooms only)
Mesh routing around obstacles
Ligature-risk impact
Minimal (uses existing infrastructure)
Significant (cable runs, wall penetration)
Minimal (surface-mounted beacons)
How Bluetooth Panic Buttons Work Without WiFi
The signal path is straightforward: wearable device to BLE beacon mesh to gateway to cloud platform to alert routing. Each layer eliminates single points of failure.
BLE operates on 2.4 GHz using a different transmission protocol than WiFi, designed for low-power operation. Devices spend most of their time in sleep mode between transmissions [11], which is why commercial BLE beacon systems achieve 3-year battery life on standard batteries [12]. No wiring. No electrical infrastructure. No conduit runs through ligature-resistant walls.
The mesh topology is the critical differentiator. When a staff member presses a bluetooth panic button, the signal reaches the nearest beacon, which relays it through the mesh network to a gateway. If a beacon fails, the network automatically reroutes messages through alternative paths without manual setup [13]. Self-healing networks keep working during outages by rerouting signals around any beacon that goes down [14].
During a 4-hour power outage at one facility, the BLE mesh continued operating because its infrastructure does not depend on facility power [15]. WiFi access points were down. Hardwired systems on the same circuit were down. The BLE mesh kept working. Facilities that experience longer outages should verify battery reserves against their specific risk profile.
The BLE mesh operates on a dedicated private network [16]. It does not add traffic to your clinical network or open new entry points for security threats.
Coverage, Uptime, and Performance Data
Technical architecture claims require performance data. CTOs evaluate systems on documented metrics, not vendor assertions.
Coverage: BLE mesh achieves 100% facility coverage verified through site surveys, providing room-level accuracy [15]. Coverage extends to parking lots, stairwells, outdoor courtyards, and transition areas between buildings. CTOs reviewing site survey results should ask whether surveys were conducted with doors in both open and closed positions. Metal-reinforced doors in locked position create meaningfully different signal loss than propped-open doors during a walkthrough.
Uptime: SLA-verified system uptime reaches 99.9% across deployments, independent of WiFi or facility network availability [15]. Healthcare life-safety systems target 99.9% uptime, allowing about 8.76 hours of unplanned downtime annually [17].
Response performance: 93% of incidents resolved in under 2 minutes across all facility areas, including previously uncovered zones [15]. That 93% figure means roughly 7% took longer, and campuses with multiple buildings connected by outdoor walkways will likely see variation in peripheral areas.
Want to understand what this looks like at your facility? Talk to us.
Deployment Without Infrastructure Disruption
BLE mesh operates on dedicated private networks separate from facility WiFi [16], eliminating IT burden on clinical network infrastructure. Self-healing mesh design means built-in backup paths [13], and the network reroutes traffic around failed nodes without manual intervention [14].
The deployment evidence is specific. A facility manager reported no disruption to patient care or additional workload during deployment [15]. Battery-powered beacons with 3-year life require no wiring, and time to value is documented at under 6 months [15].
CNOs report that staff adoption (getting clinicians to actually wear the badges consistently) often takes longer than the technical deployment itself.
TCO Component
WiFi-Dependent
Hardwired
BLE Mesh
Capital hardware
Low (uses existing WiFi)
High (cable, conduit, electrical)
$182 per badge [15]
Installation labor
Low to moderate
High (weeks to months)
Low (days, no wiring)
Network impact
Adds traffic to clinical WiFi
None (dedicated wiring)
None (dedicated private network)
Ongoing maintenance
WiFi network maintenance shared
Cable and endpoint maintenance
Battery replacement every 3 years
Coverage expansion
Requires WiFi extension
Requires new cable runs
Additional beacon placement
Ligature-risk modification
Minimal
Significant (wall penetration)
Minimal (surface mount)
Total cost of ownership goes beyond the sticker price, covering deployment, operations, maintenance, and replacement [18]. The $182 per badge CapEx enables direct comparison against infrastructure-heavy alternatives.
Evaluating WiFi-Independent Safety Systems: A CTO Checklist
Does the system operate independently of facility WiFi? Ask vendors to specify what happens during a complete WiFi outage. Ask about beacon power needs, battery life, and whether any wiring is required. Ask for deployment timelines for a facility matching your bed count and building construction. Request documented evidence of system behavior during facility power outages.
2. Security Architecture
BLE mesh systems transmit alert data using AES-128 encryption at both the mesh network layer and the application layer [16]. BLE mesh operates on dedicated private networks separate from facility WiFi, so safety systems do not add security risk to clinical infrastructure [16]. Ask vendors for current HITRUST r2 and SOC 2 Type II certifications. Ask about data retention policies and storage location.
3. Integration Capabilities
Ask whether the vendor provides REST API access. Ask about existing EHR integrations, nurse call system compatibility, and dispatch or 911 integration options. Ask how alert data flows to existing systems and whether webhook architecture supports real-time event notification.
4. Reliability Metrics
Request documented uptime SLA, not targets. Ask how the system handles individual beacon failures. Ask about the ongoing maintenance burden: what does your technology staff need to do weekly, monthly, annually?
5. Coverage Proof
Ask how coverage is verified. Site surveys with room-level mapping are the standard for BLE mesh deployments. Ask about parking lots, stairwells, outdoor transition areas, and any location where current WiFi does not reach. Room-level accuracy is the standard for staff duress systems.
Category
Key Question
Evidence to Request
Infrastructure
WiFi independence during outage
Documented performance during power/network failure
Security
Network isolation from clinical systems
Certification records (HITRUST, SOC 2)
Integration
API-first architecture
REST API specs, webhook details
Reliability
Documented uptime (not target)
SLA-verified uptime metrics across deployments
Coverage
Dead zone elimination method
Site survey results from comparable facilities
Before your next evaluation meeting, confirm you can answer these:
Can you produce a current RF heat map showing dead zones overlaid with incident location data from the past 12 months?
Does your vendor’s documented (not projected) uptime meet the 99.9% life-safety threshold across facilities with construction similar to yours?
Do you have written confirmation of system behavior during a full facility power outage, backed by evidence from an actual outage event?
Can your security team verify that the safety system operates on a network fully isolated from clinical infrastructure, with current HITRUST r2 or SOC 2 Type II certification?
Does your site survey protocol test signal propagation with metal-reinforced doors in closed and locked position?
The Architecture Decision That Defines Coverage
The infrastructure constraints that define behavioral health facilities are permanent. Older buildings with concrete and masonry construction. Metal-reinforced doors. Locked units. Outdoor transition areas. These features are not going away.
BLE mesh architecture operates independently of the WiFi infrastructure you may not have, deploys without the IT resources you cannot spare, and delivers documented reliability across every area of your facility, including the ones that show up on both your dead zone map and your incident reports.
Staff who protect patients deserve a bluetooth panic button system built for the buildings they actually work in.
COVERAGE PROOF
Ready to Evaluate WiFi-Independent Architecture?
ROAR's behavioral health technology specialists understand the unique infrastructure challenges of psychiatric facilities. For organizations assessing coverage requirements, we provide site assessments that document dead zones before deployment.
Peer CNOs who pass surveys confidently can show what happens after staff report an incident, not just that staff reported.
The shift from episodic preparation to continuous evidence generation is the common thread among nursing leaders whose teams demonstrate capability on demand.
Knowing where your investigation follow-through stands against peer benchmarks tells you exactly where to focus before your next survey.
Nearly half of nurses say workplace violence incidents are simply ignored after being reported. [1] Surveyors know this pattern. When they pull a random incident from your logs and ask to see the investigation trail, the answer reveals whether your program is actively managed or just actively documented. Peer CNO safety insights from facilities passing surveys confidently point to the same differentiator: it’s not whether your team reports incidents. It’s whether you can show what happened next.
How Peer CNOs Prepare Differently
Nursing leaders at survey-ready facilities have made a common shift. They’ve moved from preparing for surveys as a periodic event to building systems that generate evidence continuously. The difference shows up in how their teams handle the everyday moments that surveyors eventually ask about.
Investigation follow-through. When surveyors pull a random incident, peer CNOs can show the full trail: initial report, investigation notes, corrective actions, resolution, and communication back to the reporting staff member. Most facilities have the initial report. The trail goes cold after that.
“Most facilities have the initial report. The trail goes cold after that.”
Staff readiness across shifts. Surveyors interview nurses on nights and weekends deliberately. [3] Peer CNOs prepare all shifts equally by embedding safety discussions into shift huddles and post-incident debriefs, building current awareness rather than relying on annual training recall. [5]
Evidence speed. Survey-ready CNOs produce 90 days of incident data by unit within minutes. At-risk facilities spend hours compiling scattered records from multiple systems. When a surveyor is standing in your facility, that time gap defines the conversation.
Reporting culture. Only about a third of nurses say their employer gives them a clear way to report incidents. [1] Peer CNOs have addressed this by removing reporting barriers through automated capture. When reporting becomes effortless, the data starts reflecting reality rather than a fraction of it.
The Peer Benchmark
Where does your nursing program stand against peer CNOs preparing for the same surveys?
Area
Survey-Ready Programs
Most Programs
Investigation follow-through
Every incident has documented findings and corrective actions
Reports filed, investigation sporadic or missing
Evidence production
90 days of data by unit in under 5 minutes
Hours of manual compilation from scattered systems
Staff interviews
Nurses demonstrate protocols confidently across all shifts
Automated capture reflecting actual incident volume
Manual logs capturing a fraction of events
Facilities with documented safety systems show 93% of incidents resolved in under 2 minutes. [2] That benchmark matters because surveyors have seen it at other facilities. When your data shows longer times or doesn’t exist, the comparison works against you.
81% of workplace violence incidents go unreported. [4] Peer CNOs don’t treat this as an abstract problem. They treat it as a gap that automated capture can close, so their numbers actually reflect what’s happening on the units.
If you want to see where your investigation follow-through stands against peer benchmarks, we can walk you through it.
What Survey Confidence Looks Like for Nursing Leaders
Peer CNOs who describe survey experiences as confident rather than stressful share a pattern: their teams interact with safety systems daily, so describing protocols to a surveyor feels natural.
In facilities with documented safety systems, the share of staff who feel “very prepared” to respond to incidents nearly doubled after deployment. [2] Staff who’ve practiced response protocols show the kind of knowledge surveyors recognize immediately. Staff who attended annual training and haven’t touched the system since show vague recollection. The difference becomes obvious within 30 seconds of a surveyor conversation.
Facilities with documented safety technology have passed every Joint Commission and OSHA inspection in tracked deployments. [2] But the outcome peer CNOs emphasize isn’t the pass rate. It’s that their charge nurses can walk a surveyor through the response protocol, pull up response time data, and show investigation follow-through without needing to call anyone or check a binder.
Before your next survey window, test yourself against peer benchmarks:
Investigation trail test. Pull 5 random incidents from the past 90 days. Does each have documented investigation findings, corrective actions, and communication back to the reporting staff?
Evidence speed test. Can you produce 90 days of incident data by unit within 5 minutes? If it takes a phone call to get started, that’s your answer.
Night shift readiness. Ask 3 nurses from different shifts to demonstrate the duress response protocol. Do their answers align?
Reporting reality check. Does your incident count reflect what your night shift nurses would describe in a confidential conversation, or does it look artificially low?
Post-incident process. When staff report an incident, do they know what happens next? If they believe reports disappear into a void, your reporting culture has a gap surveyors will find.
Start with the investigation trail test. Pull those 5 incidents. What you find will tell you exactly where your program stands relative to peer CNO safety insights, and where to focus before surveyors arrive.
PEER BENCHMARKS
See How Your Nursing Program Compares
Peer CNOs produce 90 days of incident data by unit in minutes. See what survey-ready evidence systems look like for nursing leadership.
Surveyors evaluate nursing units on documented evidence across four categories: response capability, incident tracking, staff readiness, and investigation follow-through.
The gap between manual and automated documentation shows where most unit-level citations originate.
A pre-survey checklist helps CNOs verify their units can produce evidence on demand across all shifts.
Surveyors don’t evaluate your violence prevention program from a conference room. They walk your units, interview your charge nurses, and pull random incidents to trace the follow-up trail. This nursing safety brief covers what your units need to produce when that happens, organized by the evidence categories surveyors actually assess.
Manual vs. Automated Evidence at the Unit Level
The documentation challenge for nursing units is specific: staff focused on patient care during a crisis don’t stop to log timestamps. 81% of workplace violence incidents go unreported by healthcare workers who experienced them [1], and only about a third of nurses say their employer gives them a clear way to report incidents at all [2]. Manual records reflect what staff remember to document after the fact, not what actually happened.
That gap shows up when surveyors start pulling records:
“The test: can your charge nurse produce any of these within 30 minutes of a surveyor request? If producing evidence requires calls to multiple departments or hours of spreadsheet compilation, that’s the gap to address.”
Documentation that training covers de-escalation specific to your patient population
Investigation follow-through:
Complete investigation files for every documented incident: root cause analysis, corrective actions, completion dates, and communication back to reporting staff
Surveyors pull 5-10 random incidents and review the full trail for each [4]. Every one needs to hold up.
The test: can your charge nurse produce any of these within 30 minutes of a surveyor request? If producing evidence requires calls to multiple departments or hours of spreadsheet compilation, that’s the gap to address.
Want to see what unit-level survey evidence looks like for your nursing team?
Start with the night-shift test. That single conversation tells you whether your nursing safety brief preparation has reached the staff surveyors will actually interview, or whether it stopped at the day-shift huddle.
SURVEY READINESS
Prepare Your Nursing Units with Documented Evidence
CNOs at behavioral health facilities with documented safety systems walk into surveys knowing their units can prove capability. See what that looks like.